2019 General Election MRP predictions – Survation and Dr Chris Hanretty
2019 General Election MRP predictions – Survation and Dr Chris Hanretty
In the weeks leading up to the 2019 General Election, I worked with Survation to produce constituency-level predictions using MRP (multilevel regression and post-stratification) modelling.
The MRP model worked well, and well enough that we’re now looking at some of the additional insights the MRP model can offer.
On the national level, the story we told was broadly correct: we predicted:
– a large Conservative majority (prediction: 353 Con seats; actual results, 365 seats)
– a slump for Labour (prediction: 219; actual, 202)
– stagnation for the Liberal Democrats (prediction: 11; actual, 11)
At the constituency level, we were able to call 94.3% of seats correctly. If you applied a uniform national swing in England, Scotland and Wales, using the actual 2019 results, you would be able to predict 92.7% of seats correctly.
The model wasn’t perfect, and annoyingly we made some changes in the final model which made us less accurate. If we’d stuck to an earlier model, we’d have ended up within three seats of the final Conservative figure.
But given the model and the final results, we can start looking at some of the constituency breakdowns by different groups.
Here, I’ll focus on breakdowns by age and gender. These are two important variables in the MRP model. They’re not the most important variables (most of the work in explaining how individuals vote is done by variables which measure respondents’ past vote choice), but they do give us an insight into some of the demographic groups that parties need to convince.
The breakdowns that I show have been adjusted to bring them in line with the known election results. That means that if you add up the predicted votes from all of the groups I discuss, they add up to the votes won by each of the candidates. However, because there’s still uncertainty about the contribution of each group, the breakdowns that I show still have some uncertainty surrounding them.
The breakdowns assume that age and gender groups have the same effect everywhere – that being a pensioner in Poole changes your chances of voting Conservative in just the same way as being a pensioner in Pimlico. That doesn’t mean pensioners in different places vote in exactly the same way; the baseline probability of voting Conservative is also affected by lots of other variables in the model. Whilst being a pensioner always makes you more likely to vote Conservative, the starting point for any given pensioner can be very different.
I explore three scenarios. The first scenario is an extreme scenario. It’s a general election where only 18 and 19 year olds vote. This age group – which was not old enough to vote in the 2016 referendum and in the 2017 election – is much more pro-Labour than the population as a whole. If only this age group had voted, we would have seen a huge Labour landslide. Because the 18 to 19 year old age group is quite small, there’s a reasonable amount of uncertainty: Labour could have won between 526 and 556 seats (this is the 95% credible interval. Fig.1 below shows the central estimate, 539).

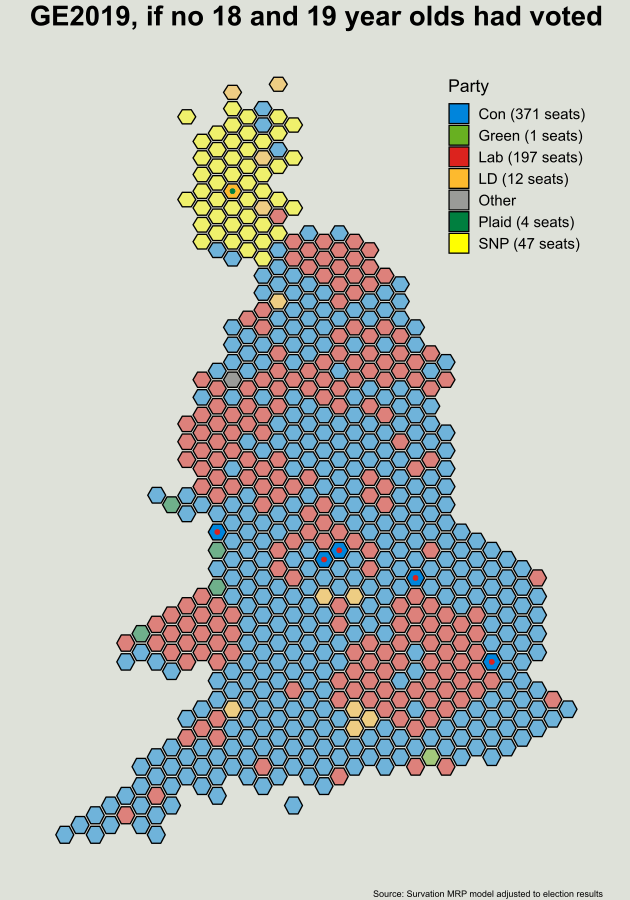
The second scenario is slightly more realistic, and reverses our previous scenario. Now, instead of only 18 and 19 year olds voting, it’s everyone but 18 and 19 year olds. In effect, this scenario makes the electoral franchise look more like it did before the passage of the Representation of the People Act 1969, which changed the age of suffrage from 21 to 18.
In this scenario, the Conservatives win 371 seats (95% credible interval: 370 to 374), an increase of six over their actual tally. Six seats, all with very narrow majorities, flip over to the Conservatives. To take one example: Dagenham and Rainham, won by Labour’s Jon Cruddas with a majority of 293 votes over his Conservative challenger, is, in this counterfactual, lost to the Conservatives as he loses out on between 550 and 950 votes from 18 to 19 year olds, much more than the 130 to 250 votes lost by his Conservative challenger.
The final scenario shows the effects, at seat level, of a recent change in voting behaviour. In the 2017 election, women were much more likely to vote for the Labour party. That continued in 2019. If only women had voted, we would have ended up with a hung parliament with seat tallies close to those won by the parties in 2017 election.

These are only a few simple scenarios. You can get similar results sometimes by adding on or subtracting a national swing to each seat – though in extreme scenarios, like our first scenario, you might have to tolerate negative vote shares for some parties. The great benefit of MRP is that, because we make seat level predictions by adding up predictions for all unique combinations of our predictor variables, we can explore the impact of excluding or including narrowly drawn groups (women under 35 who voted Remain, or men over 55 with a university degree) – and in that way, show which groups were pivotal to the election results in particular areas.
Dr Chris Hanretty, Professor of Politics, Royal Holloway, University of London
About the data
The MRP (multilevel regression and post-stratification) simulation of 2019 General Election seat shares provides estimates for nine parties across all (631) constituencies in Great Britain except Chorley (which featured the Speaker seeking re-election). Fieldwork for the final model was between 16th November 2019 and 10th December 2019. Survation interviewed 42,138 respondents via online panel and telephone (using a combination of mobile and landline data). The final model provides projections for 10th December 2019. MRP data tables are available here.
Overall, fieldwork for our MRP models was conducted over a trailing 25-day period for each model, going back to 21st October 2019. The total number of respondents was 85,000, with models including only respondents interviewed in the 25 days prior to computation.
Here are some notes on the data tables:
‘Seat tally’ shows the average (mean and median) seat estimates, and a 95% credible interval. That is, had the election occurred on 10th December 2019, the seats won by each party would have had a 95% chance of falling within these intervals. Please note that seat tally is probability based; it does not exactly correspond with the total number of seats a party is “leading” in.
‘Vote share’ shows the forecast national (GB) share of the vote.
‘Con seats’ shows probability estimates for different ranges of Conservative seat counts.
‘Seat results’ shows, in each constituency, predicted party vote share and the 95% credible interval.
‘Win probabilities’ shows, in each constituency, the probability that a given party would win the seat.
Subsequent sheets show predicted national vote shares according to various demographic and political characteristics: age, gender, highest level of qualification, 2017 general election vote, 2016 EU referendum vote, 2017 general election vote by 2016 EU referendum vote.
Estimates for parties which are not standing in a seat are zero.
Parties can win seats without being the favourite in any particular seat.
We’d love to help…
Survation provide vital insights for brands and organisations wanting to better understand authentic opinion, adding value and credibility to the research we provide to our clients.
Want to know more about MRP? Click here to find out about how the method can be used outside of politics and about Survation’s quarterly MRP Omnibus.
Click here for information on our industry leading mixed-method market research offering.
For a quote or a chat about your research needs and our packages, contact Harry Mason on 0203 818 9662 or John Gibb on 0203 818 9661
Would you like to have your own views represented in Survation’s research work? Survation’s paid consumer opinion panel is now live!
Simply go to: https://panel.survation.com/ – register (1 minute) and we’ll credit your account with 50 points for simply confirming your email and allocate 100 points for taking a very short survey. Points convert to cash which can be withdrawn each time you reach the equivalent of £50.
You can sign up to our press release list here. Follow Survation on Twitter: @Survation
< Back