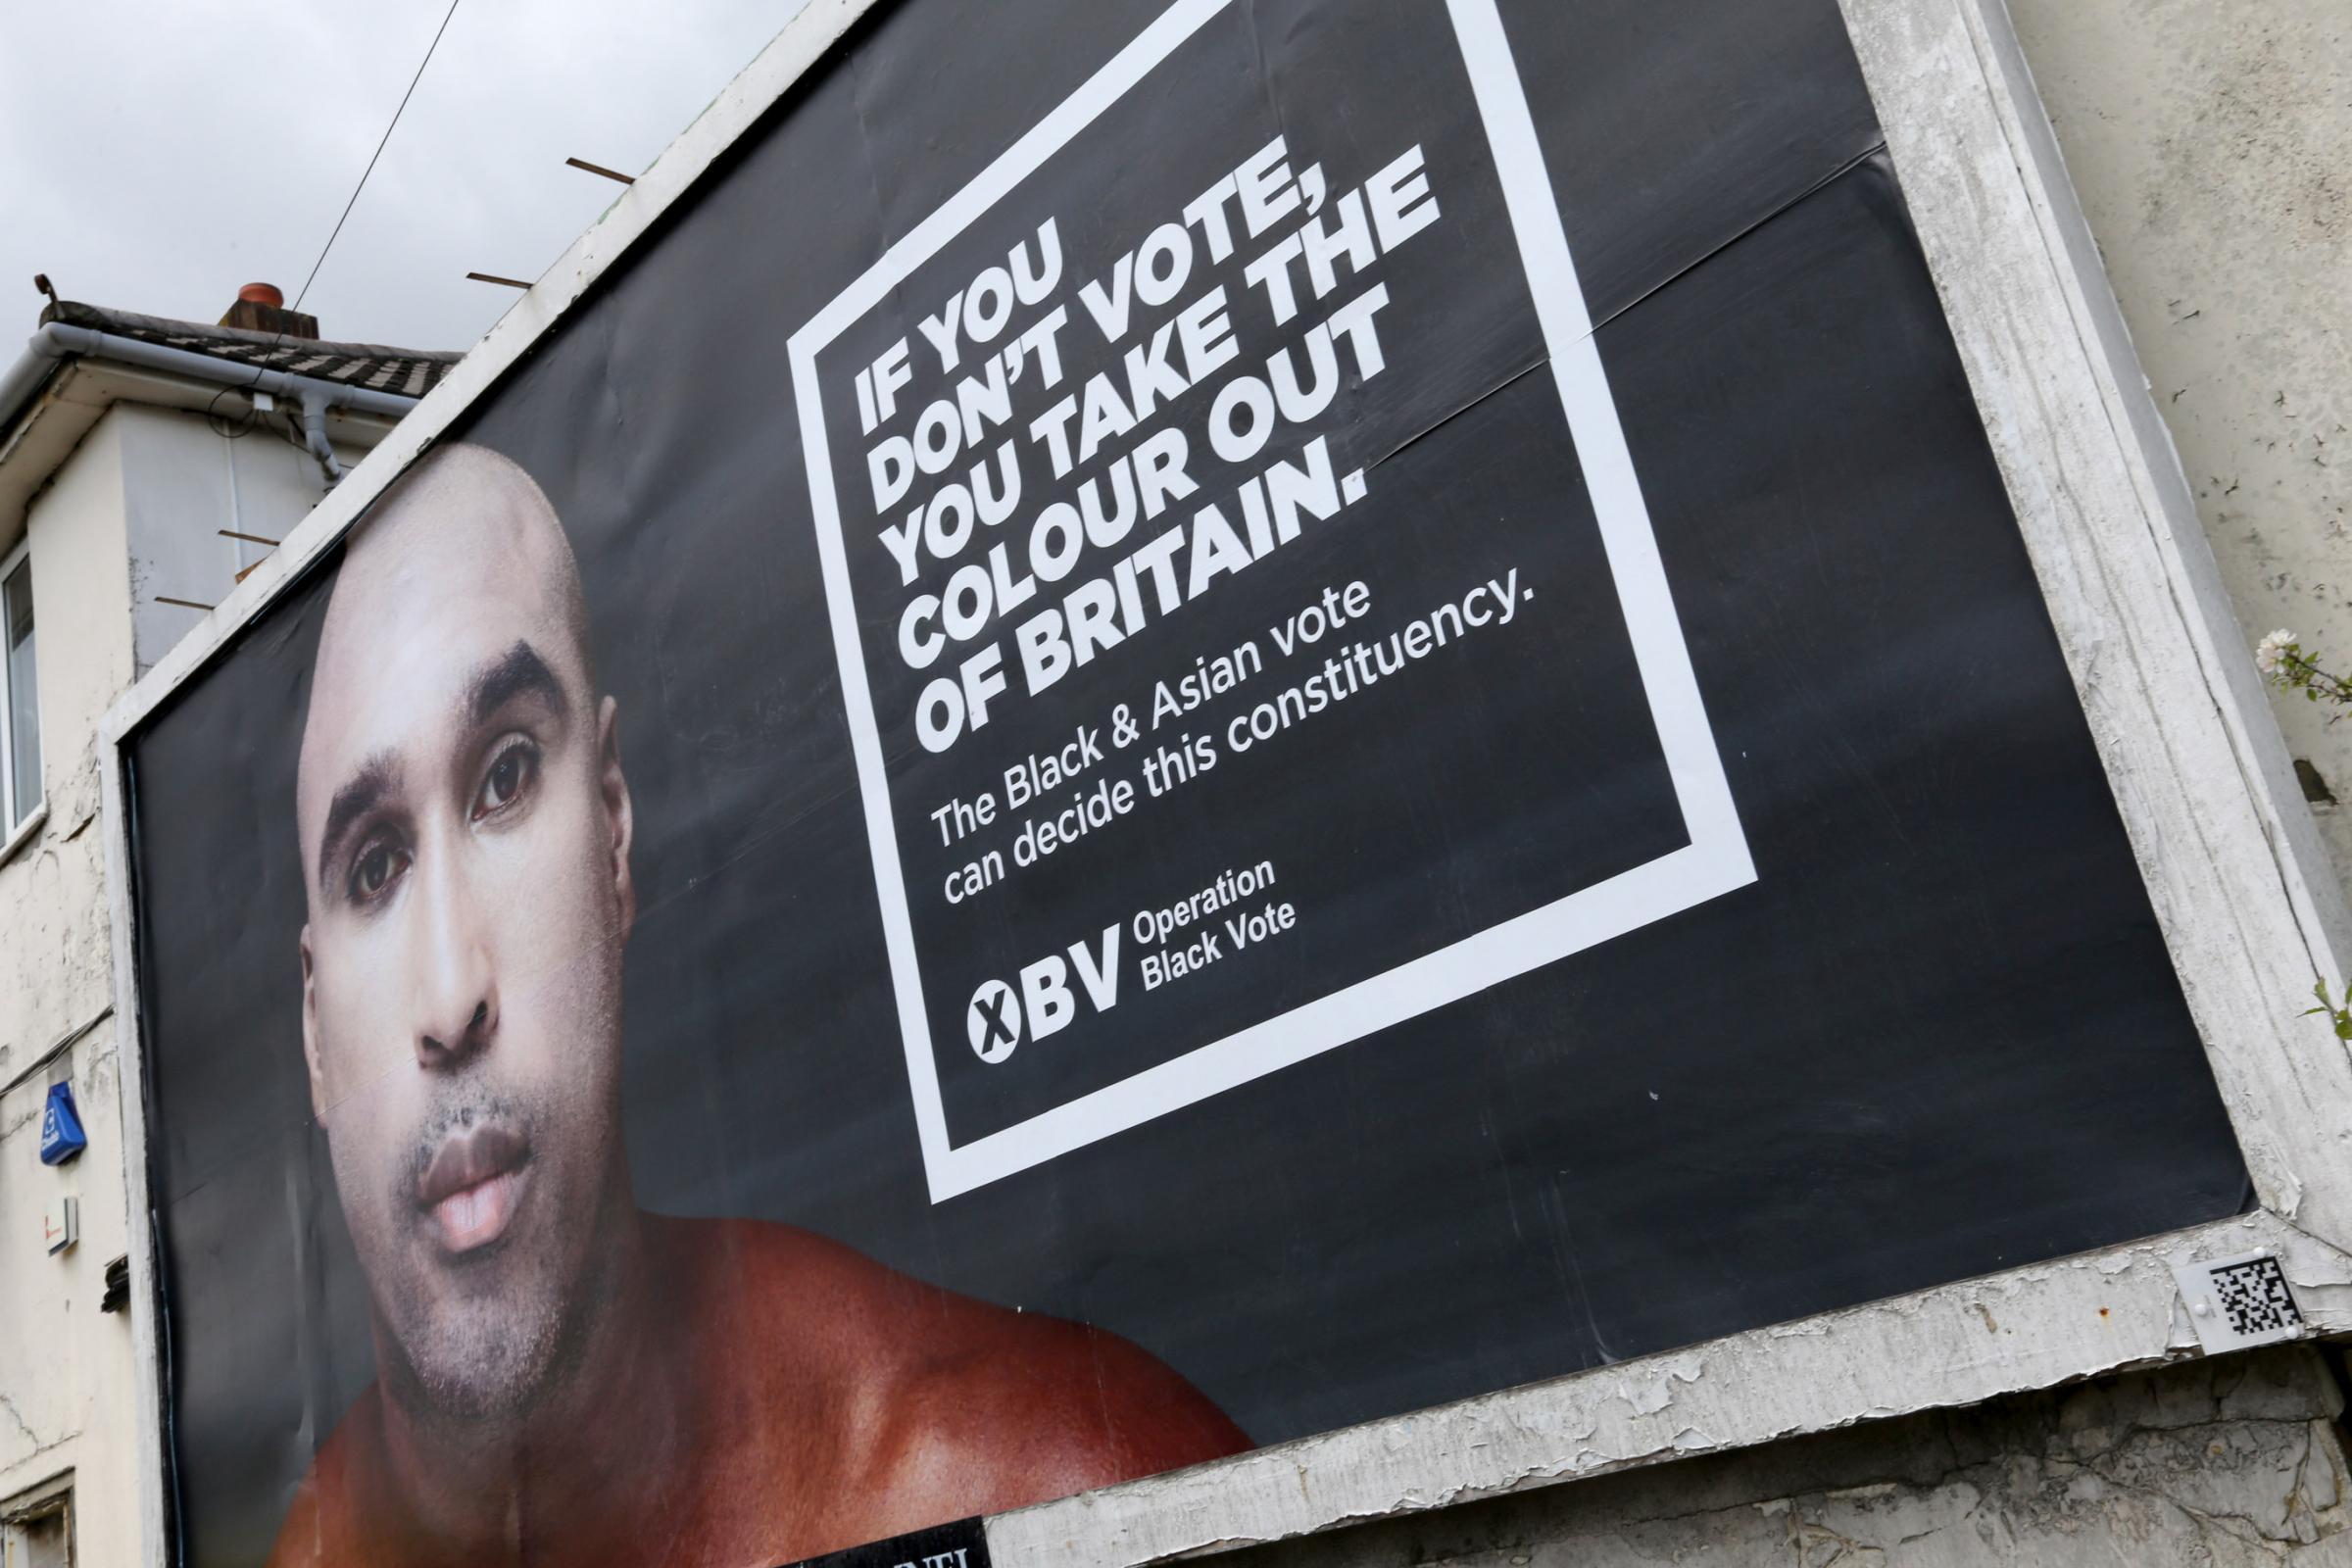
Conservatives took 1 in 3 BME votes in the General Election, latest opinion polling shows
The Conservative party took one third of ethnic minority votes in the 2015 General Election, equating to 1 million votes, Survation polling on behalf of British Future reveals. Survation conducted new online opinion polling of 2,067 black and ethnic minority voters about their voting behaviour in the 2015 general election.
A short presentation with graphics discussing the findings, by British Future can be found here:
Full tables are available here, for more discussion see British Future’s article.
One million ethnic minority votes helped put David Cameron into Downing Street on election night, according to a major new piece of research into attitudes among minority voters released today (25 May).
While Labour remains ahead with minority voters on 52%, the research finds that the gap between the two main parties is shrinking dramatically. One third (33%) of ethnic minority voters supported the Conservative in 2015, a stronger result than ever before for the party, which has historically struggled to appeal to non-white voters. Liberal Democrats and Greens took 5% of the ethnic minority vote, with 2% voting for UKIP.
The new study, the largest survey of ethnic minority attitudes to be published in the 2015 election cycle, provides surprising new insights into the political views of ethnic minorities in Britain. Conducted by Survation for thinktank British Future, it surveyed 2,000 ethnic minority respondents across Britain straight after the election from 8-14 May.
Translated into votes(1), based on an estimated 3 million ethnic minority taking part in the election, the results equate to 1.6 million votes for Labour, with the Conservatives securing one million ethnic minority votes for the first time in the party’s history. The Lib Dems and Greens both secured 150,000 ethnic minority votes, with UKIP on 75,000.
The research also reveals interesting differences in party support by ethnic group, showing much higher support for the Conservatives among Asian voters than other ethnic minorities:
Asian: 50% Labour, 38% Conservative
Black: 67% Labour, 21% Conservative
Mixed race: 49% Labour, 26% Conservative
Sunder Katwala, Director of British Future, said:
“Ethnic minority votes are more ‘up for grabs’ than ever before.
“While David Cameron clearly took a lot of votes from the Lib Dems in the election, he also seems to have extended his party’s appeal to ethnic minority voters too.
“Labour remains ahead with minority voters, but the party may have won too many of its minority votes in the wrong places electorally – doubling majorities in heartland urban seats that were already safe but slipping in the southern marginals.
“But in places like Watford, Swindon and Milton Keynes, Conservatives can be increasingly confident of their appeal to aspirational ethnic minority voters.
“The middle-England ‘Mondeo Man’ of the 2015 election could well be a British Asian.”
Different faith groups also gave very different responses, with ethnic minority Christians and Muslims preferring Labour to the Conservatives but Hindus and Sikhs* preferring the Conservatives to Labour:
Christian: 56% Labour, 31% Conservative
Muslim: 64% Labour, 25% Conservative
Hindu: 41% Labour, 49% Conservative
Sikh (small sample): 41% Labour, 49% Conservative
There were also significant differences by region, with the gap between Labour and Conservative support very small in the south and much larger in the north of England:
England: 53% Labour, 33% Conservative
South: 43% Labour, 40% Conservative
Midlands: 60% Labour, 28% Conservative
North: 60% Labour, 26% Conservative
London: 54% Labour, 34% Conservative
Omar Khan, director of the Runnmyede Trust, said:
“These findings confirm that Labour remains the preferred choice among BME voters, but also that the Conservative party has made a breakthrough in winning around a third of those votes, nearly matching their overall national vote share.
“The research also offers new evidence on what we know about voting patterns among different ethnic groups and in different areas in modern Britain.
“Labour’s vote share looks to have held up best in the top 75 most diverse seats in the UK, where half of BME people live. But with more and more BME people moving outside the major cities the conservatives appear well placed to make further gains in 2020 and beyond if they can respond to ethnic inequalities and realise BME aspirations while in government.”
Footnotes:
1. Based on estimated 10% of 29,973,577 GB votes cast. Labour 1,566,288 (possible range 1,494,674-1,639,901); Conservative 977,860 (possible range 909,703-1,046,016)
2. Sample sizes: total 2,067; voters 1,633; Asian 833, black 364, mixed/multiple 269; Christian 512, Muslim 373, Hindu 223, Sikh 63, not religious 363; England 1,490, North 214, Midlands 298, London 527, South 461.
3. British Future is an independent, non-partisan thinktank engaging people’s hopes and fears about integration and migration, opportunity and identity, so that we share a confident and welcoming Britain, inclusive and fair to all.
Survation is a member of the British Polling Council and abides by its rules.
For futher info on this work or for media enquiries email info@britishfuture.org Follow Survation on twitter: @survation & British Future @britishfuture Find out more about the services Survation provide by following this link. For press enquiries email enquiry@survation.com
< Back

