
The Great Scottish Currency Debate & An Important Note on Methodology
Headline referendum voting intention:
In the referendum, voters will be asked, “Should Scotland be an independent country”. If this referendum were held today, do you think you would vote “Yes” or “No”?*
“Yes” – 38%
“No” – 47%
Don’t know – 16%
*Results NOT comparable with previous Survation poll of 2nd Feb due to methodology change (see discussion below).
Interesting Findings – “No” Voters Pessimistic About Currency Union
On behalf of the Scottish Daily Mail, our latest Scottish independence poll has explored in depth the choice of currency facing an independent Scotland. The most potentially interesting finding relates to the difference between “Yes” and “No” referendum voters on their hopes and expectations for a new currency.
The preferences of what both “Yes” and “No” voters wanted were broadly similar, with both having an strong preference for a currency union that would enable them to keep the pound (41% for “Yes” voters and even more, 52%, for “No” voters). But when asked what they expected to actually happen, only 23% of “No” voters expected a currency union to come about, less than half of those who had wanted that as their preferred option. In contrast, fully 45% of “Yes” voters were confident that a currency union would come about.
“No” voters were instead much more likely than “Yes” voters to take the pessimistic view that Scotland would end up using the pound with no currency union and no control over monetary policy (20% held this view) and a similar number (23%) said they simply did not know what currency Scotland would end up with. “Yes” voters were far more confident, with only 9% expressing uncertainty about the future of Scotland’s currency. The mismatch between preferences and expectations among intended “No” voters can be seen strikingly in the charts below.
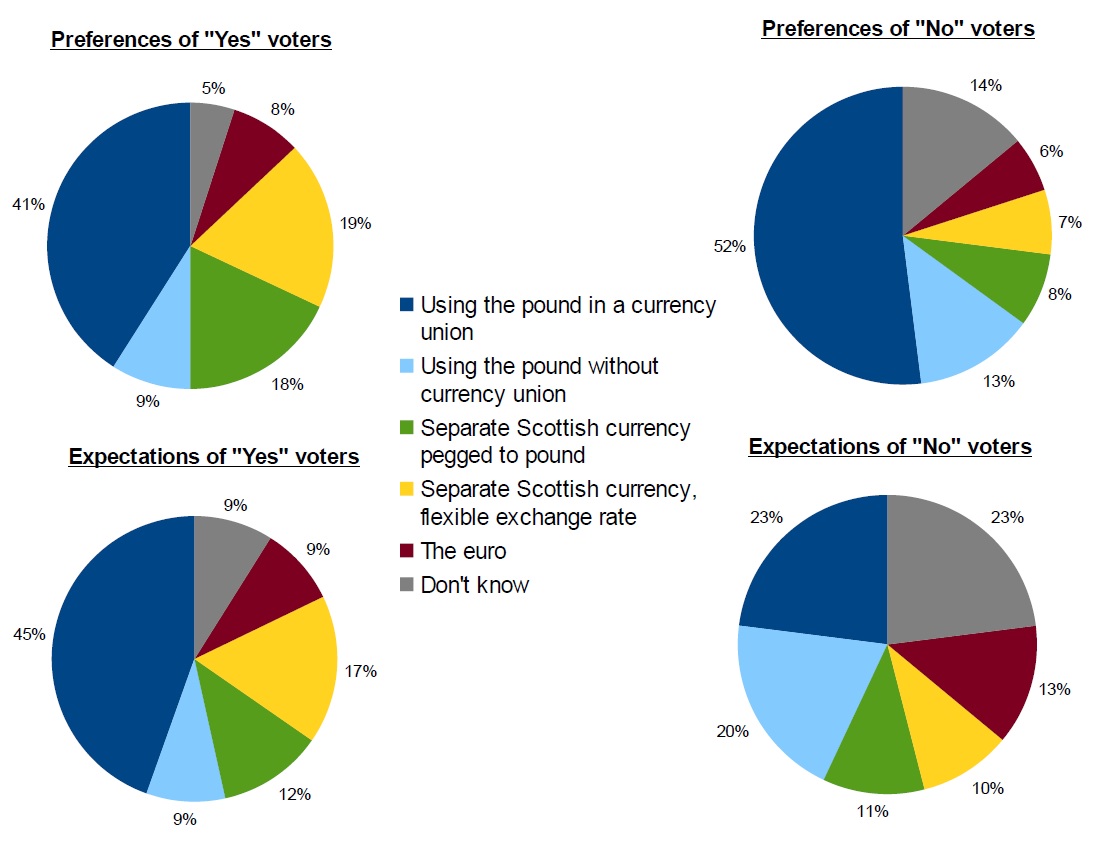
In conclusion what this would suggest is that the preferences of “Yes” and “No” voters regarding currency are largely the same (currency union), but whilst “Yes” voters expect this to happen, “No” voters believe this option is likely to fail or simply have no idea what will happen – a level of pessimism and uncertainty that is no doubt contributing significantly to their opposition to independence. If Salmond could reduce the level of uncertainty around the currency debate, perhaps by announcing a concrete Plan B, he could might be able to win over some of these wavering voters, but in the absence of greater clarity it seems likely the currency debate will continue to favour the “No” camp.

This desire for clarity is also clearly expressed when respondents were asked “Do you believe the Scottish Government should draw up alternative options to a “currency union” ahead of the referendum on September 18, 2014?”, to which a majority of both “Yes” and “No” voters expressed a clear desire for a Plan B.
Looking specifically at the intervention by the “three Chancellors” announcing they would not be willing to enter a currency union, the effects have simply been to harden the stance of supporters on both sides of the independence debate. Only 4% of “No” voters and 3% of “Yes” voters suggested it would make them at all more likely to consider the alternative option, though the reaction of solidifying support was stronger on the “Yes” side, due probably to a visceral reaction amongst nationalists against any suggestion of being threatened by English politicians.

Full data tables and all questions put are availablehere.
An Important Note on Methodology
In the interests of ensuring comparability with other best practice Scottish referendum and voting intention polls in the industry, we have taken the decision to politically weight this poll by the 2011 Scottish Parliament election results (constituency vote). This is in contrast to the previous Scottish opinion poll by Survation published on 2nd February, which was weighted by 2010 general election results in line with our usual national polling practice.
This change will bring our method in line with that used by most other pollsters operating in Scotland and so will enable better comparability between our polls and others, though of course it does mean that the voting figures in our most recent poll should not be used as a direct comparison to show changes from the previous Survation poll on 2nd February. In terms of its impact on the referendum and voting intention figures, a cursory look at the tables suggests that using 2011 weighting rather than 2010 weighting has been more favourable to the SNP in terms of voting and similarly to the “Yes” campaign for the independence referendum.
Whilst the change in methodology means that the results of our most recent Scottish poll should not be described as showing changes in public opinion compared to our previous Scottish poll, nevertheless a detailed look at how the figures are different can illuminate some of the effects of different weighting methods. A comparison of Table 12 in our poll of 2nd February (Westminster VI excluding don’t know / refused) with Table 41 in our most recent poll (asking the same question) shows the SNP vote share has been increased from 30.4% to 37.8%, whilst the Labour vote share has been diminished from 38.7% to 32.6% – an approximate reversal of the voting intentions. Likewise the lead of the “No” campaign over “Yes” has been reduced from 19.7% (Table 20, 2nd Feb) to 8.9% (Table 16, 19th Feb).
To examine the effects of the weighting procedures more closely, the below table shows the difference between key weighted and unweighted figures for both polls.
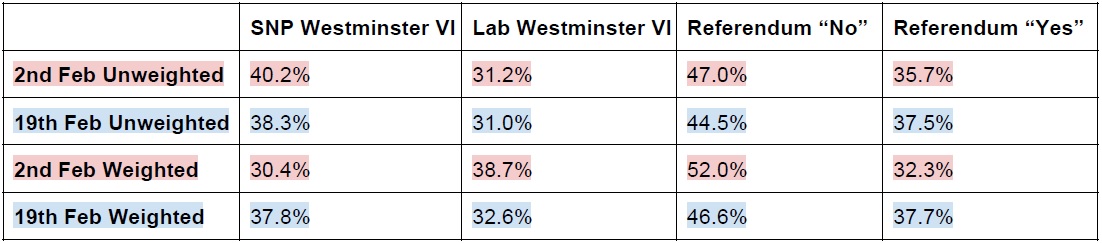
As can be seen, the effects of the previous weighting had a far greater impact on the raw figures than the updated weighted method. Taking into account the variation in the raw figures (likely more due to random sample fluctuations than any real shift in opinion during the last 20 days), the effect of changing the weighting appears to account for approximately 6.5 of the 10.8 points of apparent reduction in the “No” lead compared with the previous Survation poll. As found by other pollsters, false recall of their 2010 vote by nationalist voters is the most likely explanation for this effect.
Survation will be continuing with this 2011 weighting for future Scottish polls during this Parliament, which will mean that our polls from now on will be comparable with ICM and Panelbase polls in Scotland that generally use the same method, though possibly not YouGov which appears to use a slightly different weighting methodology. In terms of how our results compare, our figure of an 8.9% lead for “No” is entirely in line with the most recent ICM and Panelbase polls from the last month, which average out at exactly 9.0% as shown below (the ICM poll has been reported as showing a 7% lead for “No” but due to rounding errors this would more accurately be described as a 6% lead).
![]()
Director of Research, Survation
< Back