The State of Play: Can the Conservatives Turn it Around?
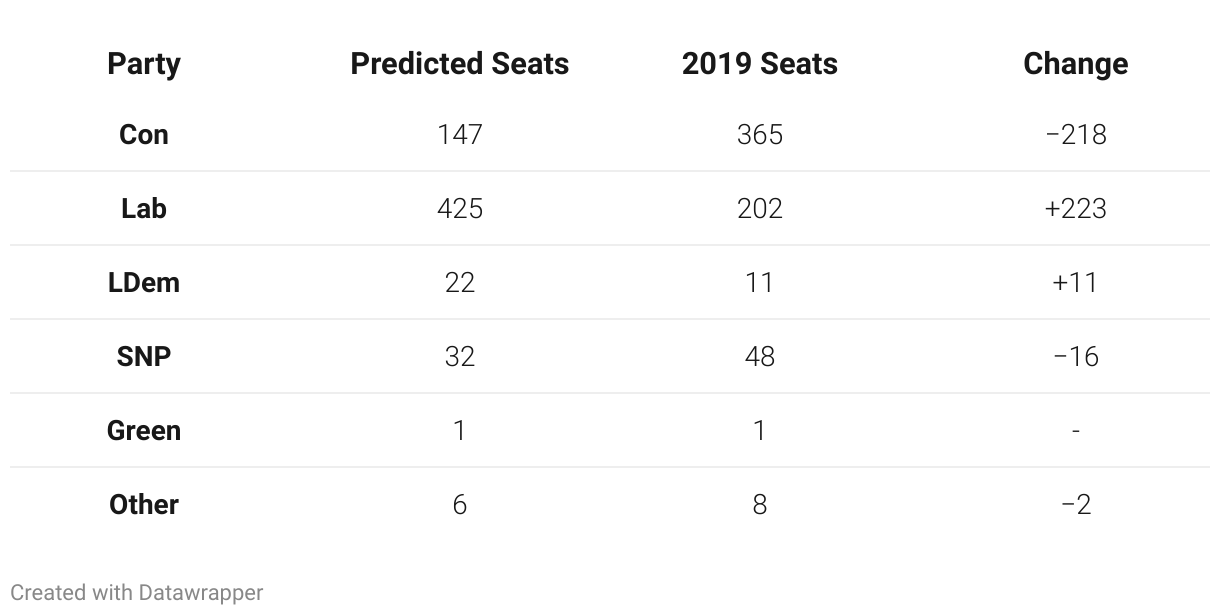
We are over one year into Rishi Sunak’s premiership and approximately one year out from the general election. Throughout September and October, Survation conducted a series of large sample polls on behalf of Greenpeace, 38 Degrees, and Lodestone Communications. We explored the results using multilevel regression and post-stratification analysis (explainer here) to produce constituency-level estimates for voting intentions. The average Labour lead over the Conservatives was 17 points. Taking the mean output from our analysis, we estimate Labour would have won 425 seats had the election been held in September / October – more than doubling their existing seat count. This would give Labour a 195 seat majority, surpassing the 179 seat majority won by Blair in 1997. Meanwhile the Conservatives would be reduced to just 147 seats.
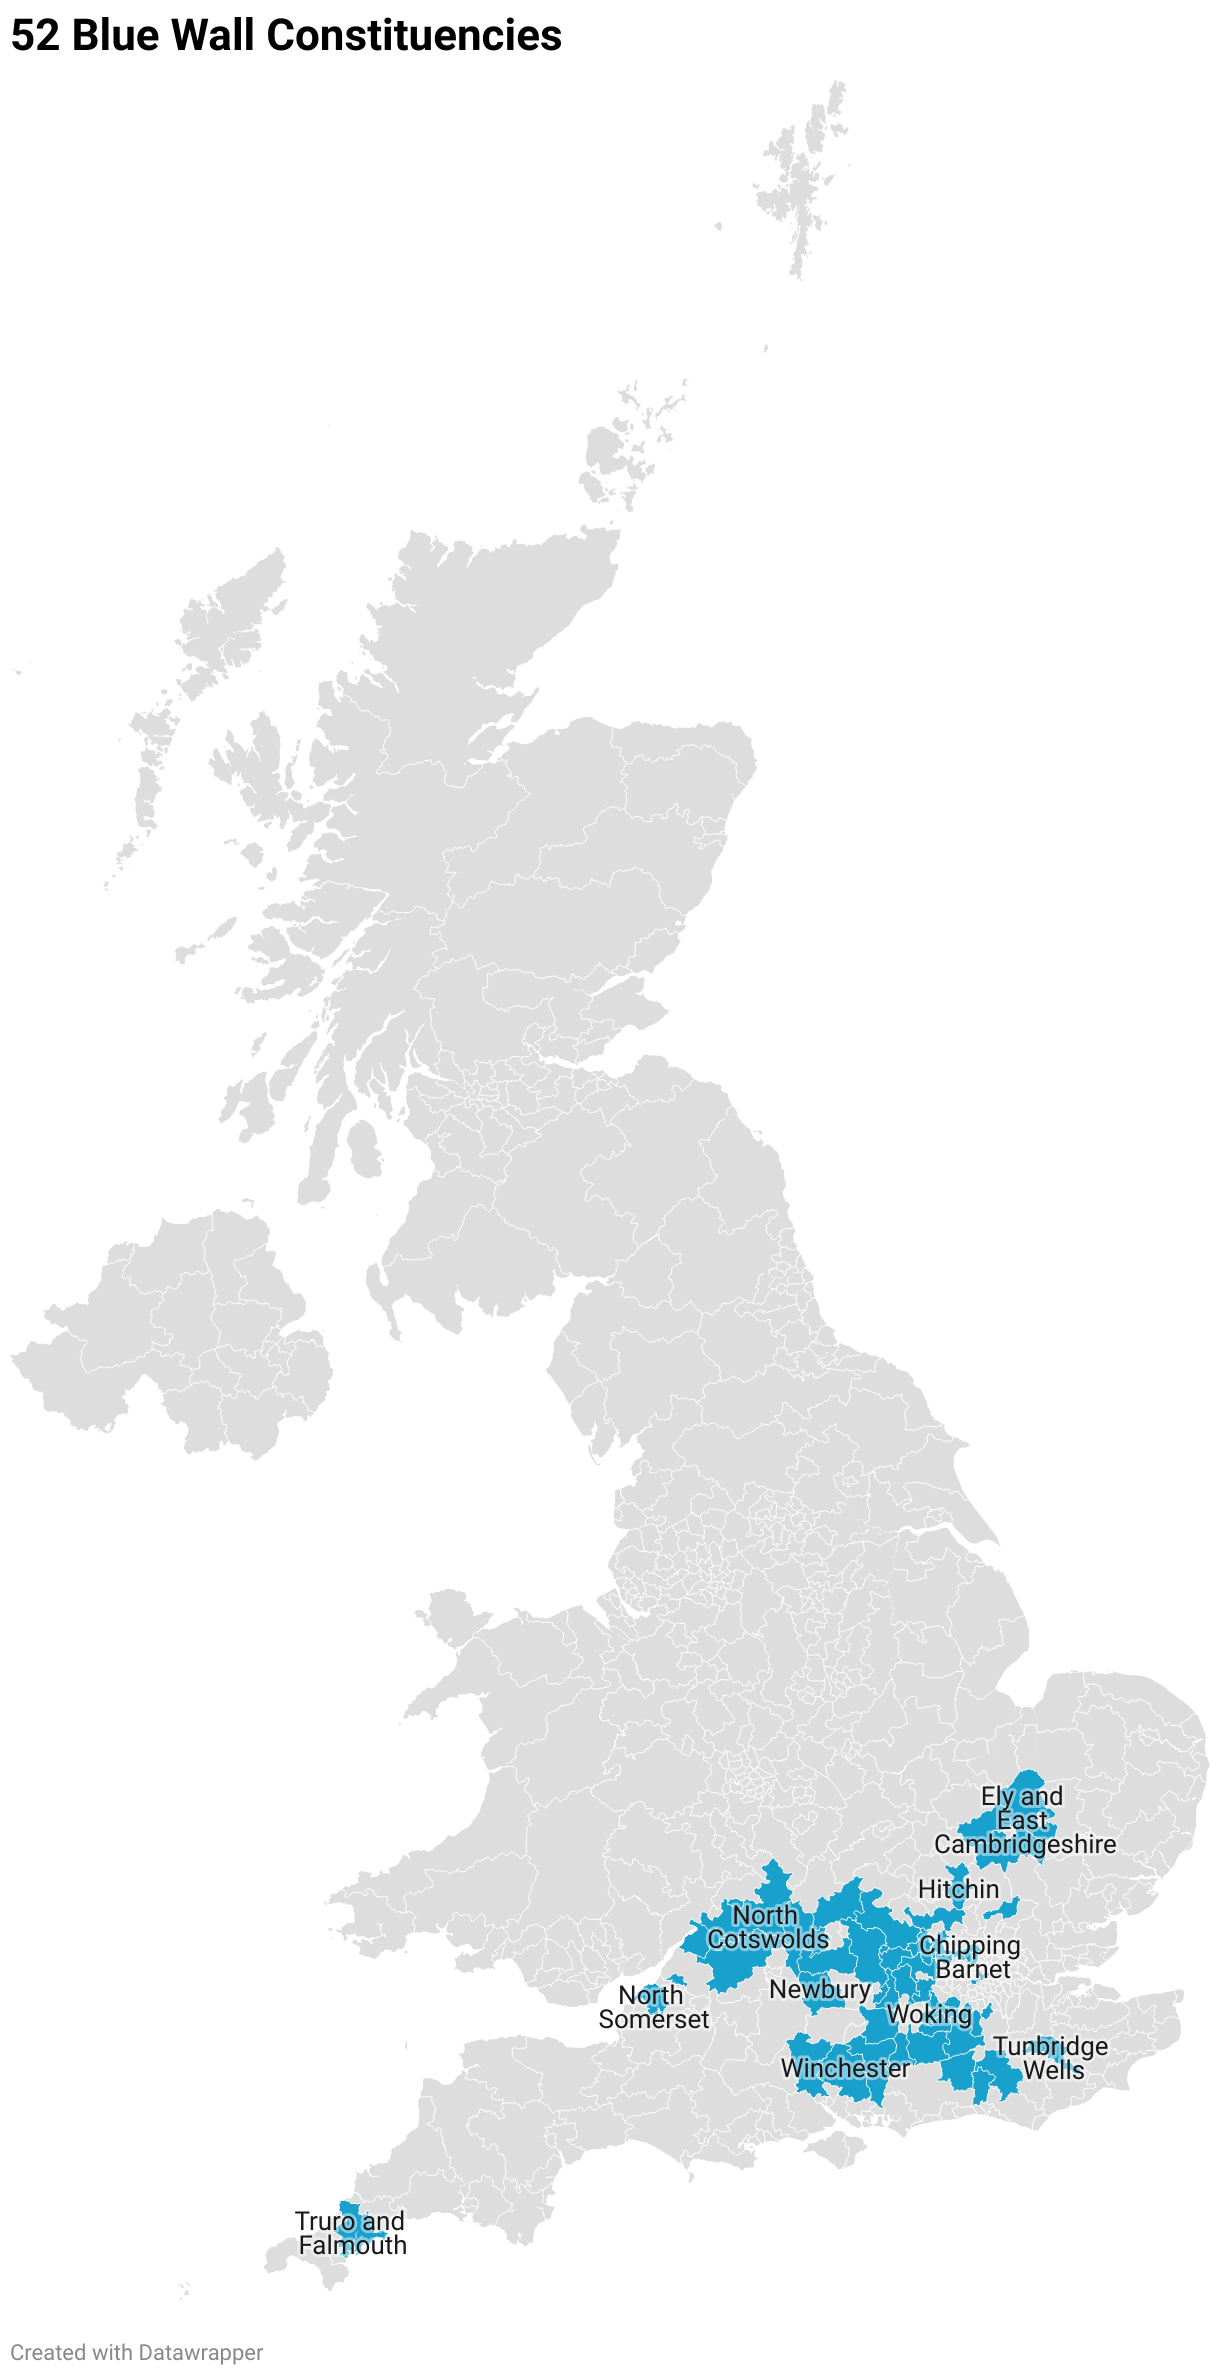
These outputs suggest 12 cabinet ministers would have lost their seats, including Deputy Prime Minister Oliver Dowden, Leader of the House Penny Mourdant, Justice Secretary Alex Chalk, and Defence Secretary Grant Shapps. Conservative strongholds in the Blue Wall like Steve Baker’s Wycombe seat, held by the Conservatives since 1951, and Liam Fox’s North Somerset, Conservative since its re-establishment in 1950, are also at risk. We estimate the Conservatives would have retained just 30 of the 52 Blue Wall seats*.
In the Red Wall, we estimate every seat the Conservatives won in 2019 would return to the Labour party. Across Britain, it is in seats with the highest proportion of leave voters that we are seeing the biggest swings back to Labour.
We are not modelling what we predict will happen next year; we are modelling what we predict would have happened had the election been held in September/October. Much can change between now and a general election, and the challenge facing Labour should not be understated. The party needs to win an additional 125 constituencies for an outright majority. To put that into perspective, in Labour’s landslide 1997 victory the party required just 59 additional seats.
That said, the prevailing view that the polls will narrow is fundamentally an assumption – though a historically validated one. Throughout March and April many pollsters were identifying such a narrowing. This was attributed to both a recovery from Liz Truss’ short premiership, where we recorded our largest Labour polling lead ever, and Rishi Sunak’s personal popularity. Six months into Sunak’s time as PM, his net approval was 2% and his party’s net approval -14%. One year in, it has fallen slightly to -1% while the Conservative Party has remained consistently unpopular at -13%. Elections are not won on leaders’ favourability ratings, and there is a tendency to overstate the importance of individual leader’s popularity. Talk of the PM as an asset to his party was exaggerated, and his leadership has not improved the Government’s polling position. The ‘Rishi revival’ never took off.
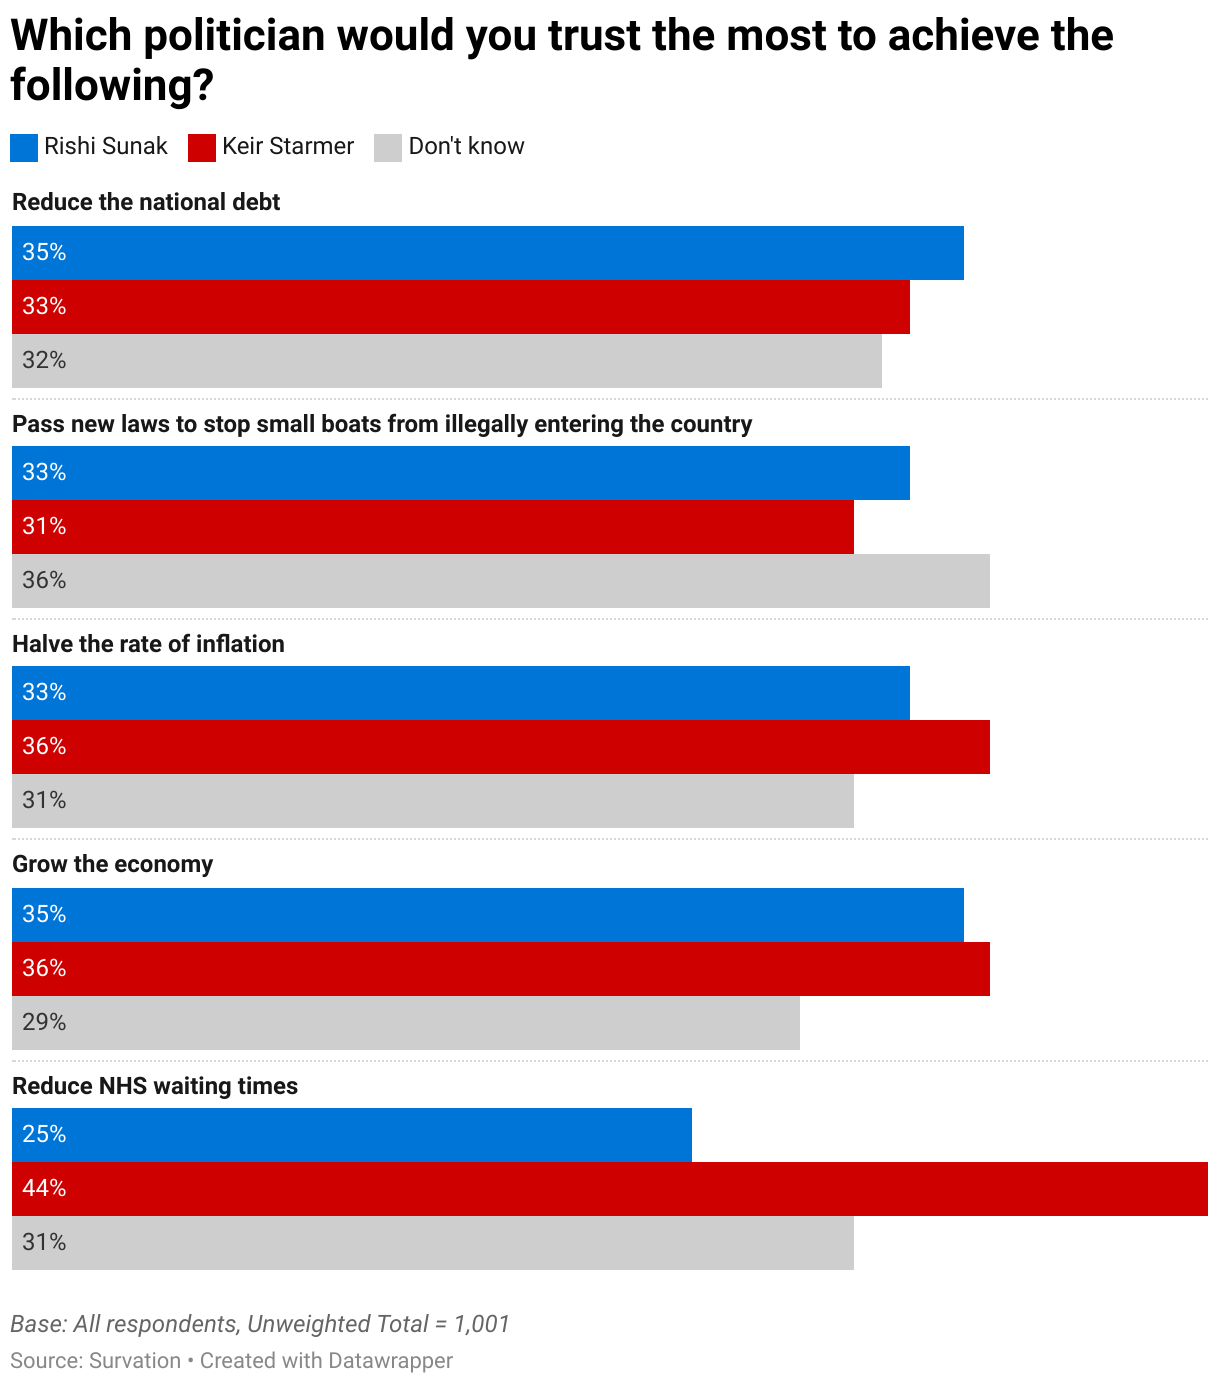
Part of Sunak’s offering was a delivery-focused government. He offered a break from the perceived naive idealism of his predecessor. However, the public trust Starmer more or as much to deliver four of the PM’s five pledges (reducing the national debt being the exception). Reducing NHS waiting times was identified as the most important pledge, and here the Leader of the Opposition has a 19 point lead over Sunak. Starmer also leads the PM across every major policy area except for defence.
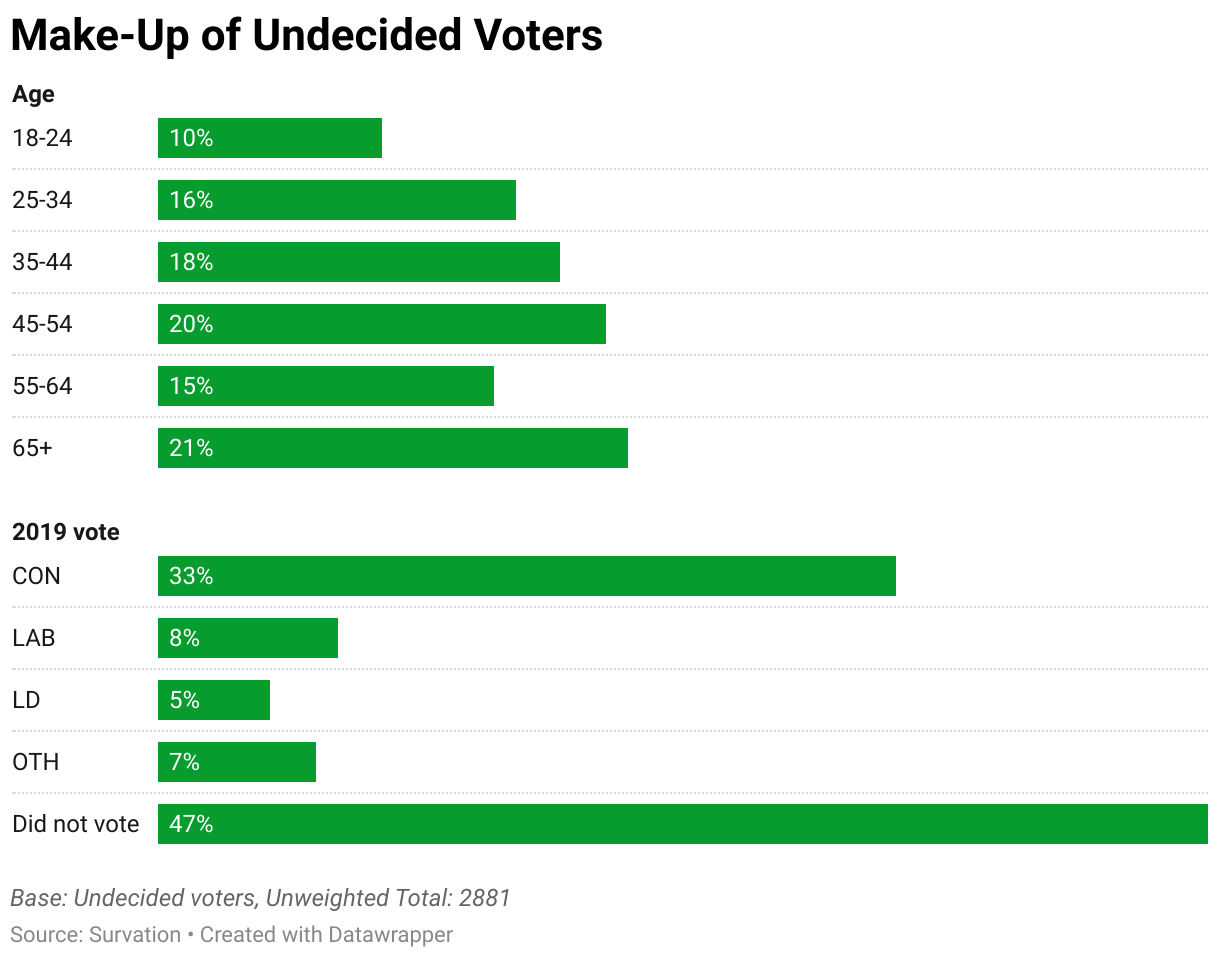
Despite this, and Labour’s 17 point lead, it has been suggested that enthusiasm for Labour is tepid. After by-election defeats in Mid Bedfordshire and Tamworth, Conservative Party Chairman Greg Hands stated there was little evidence of Conservative voters switching to Labour, and that these voters simply stayed at home. It is thought that many of those who voted Conservative in 2019 currently express their voting intention as ‘don’t know’. We know this is true. In our 20,000 person Greenpeace sample, 13% of respondents said they were currently undecided. Strikingly, those who voted Conservative in 2019 accounted for 40% of the full undecided segment.
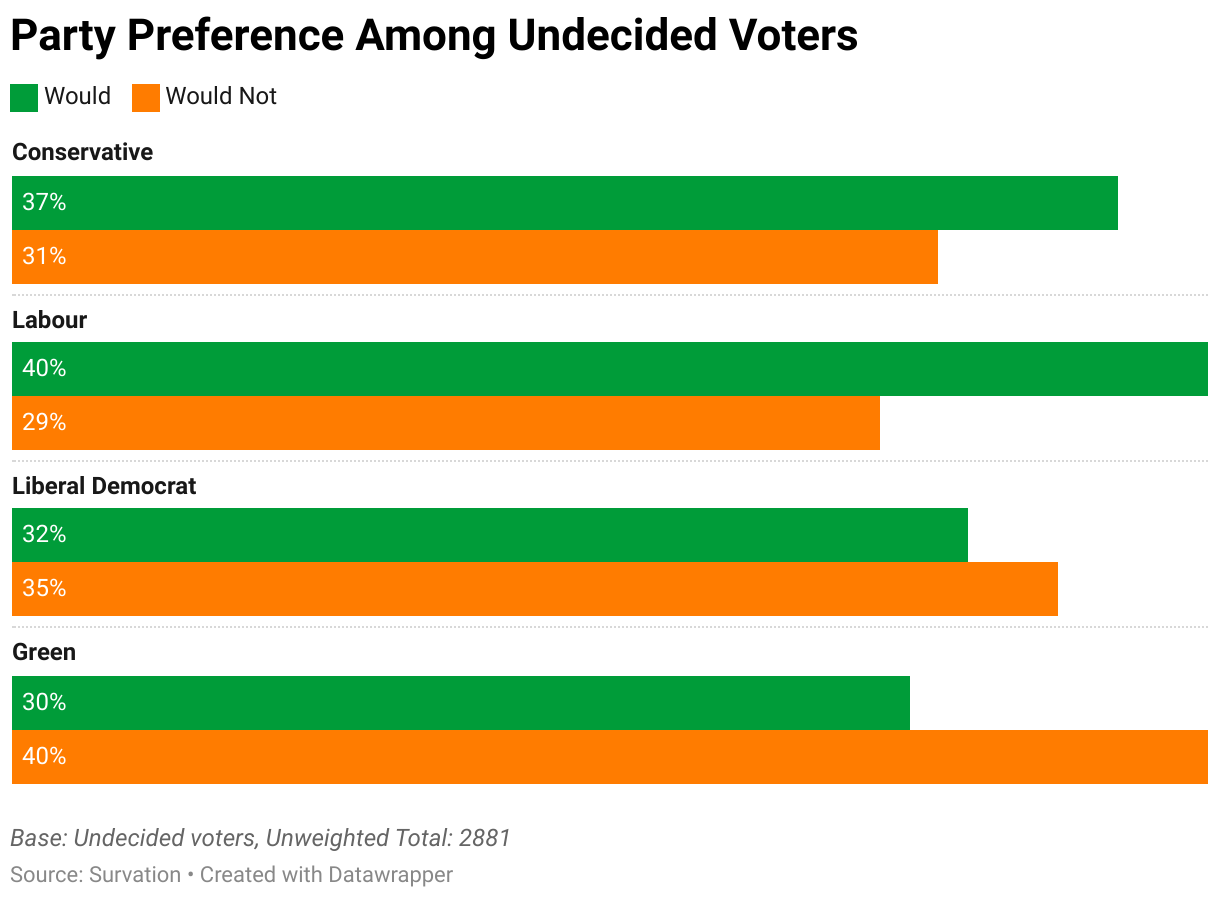
Some present these voters as an untapped resource which offer the Conservatives a narrow path to victory. Currently, this is not true. We find that a larger share of currently undecided voters would consider voting Labour (40%) than would consider voting Conservative (37%). There is little evidence to suggest that currently undecided voters are waiting to flock back to the Conservatives before the next election.
So, does it matter whether Labour’s lead is driven by apathy towards the Conservatives or enthusiasm for the party? If the former is true it might make operationalising a policy platform difficult once in government, but the strength of anti-Conservative sentiment throughout Britain is currently so overpowering that it does not look like faltering.
What currently matters to voters are the fundamentals. The cost of living is identified as the issue most likely to affect how someone votes in 583 of 632 constituencies. Health and the NHS places second in 581. People feel squeezed and believe public services are failing, and these perceptions are supported by the data. The Conservatives are not dealing with a strategy problem. They are dealing with policy failure. A successful conference season was never going to drastically change the outlook. The cost of living will dominate the election and the Conservatives must demonstrate improvement here. Without this, the Conservatives look set for a heavy defeat.
Notes
*The definition of Blue Wall follows that of English (2021). These are 52 constituencies across the South or East of England, where: the Conservative party is estimated to have won in the 2019 General Election; constituents in those seats are estimated to have favoured (50%+) Remain in 2016; constituencies contain higher than average (25%+) share of graduates (Level4+ equivalent). The original post can be accessed here. We take into account Survation-modelled estimates of 2019 General Election results, 2016 EU Referendum vote share, and proportion of population with graduate-level qualifications.
< Back