What happened in Holborn & St Pancras?
Published here for the first time as a diagnostic, Survation’s poll of the constituency, taken in the final stretch of the campaign, helps explain the result.
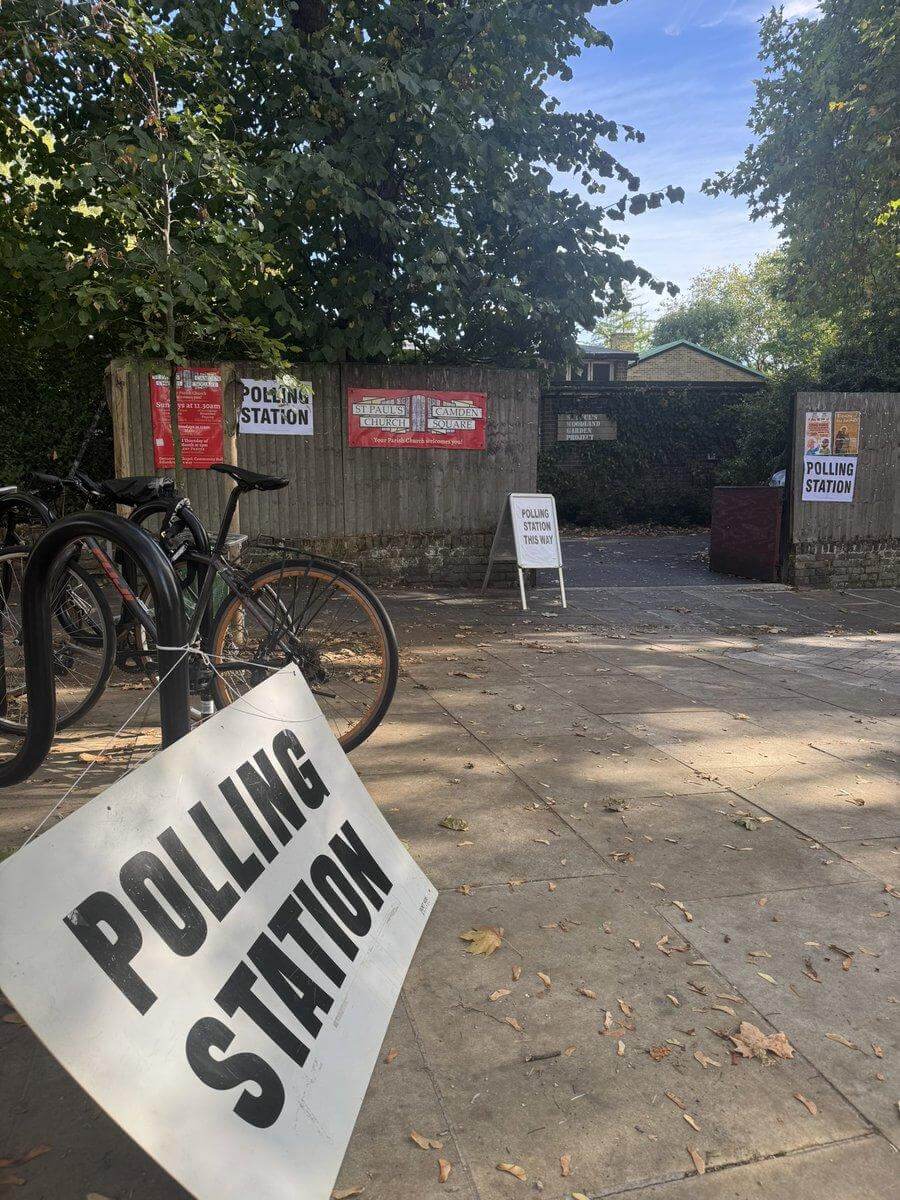
Survation’s office is a short walk from the constituency boundary, across the Islington line. Despite our proximity, we couldn’t claim any serious local qual insight, but I had been struck by what we had not seen. In Gorton and Denton, which delivered the Greens an energising victory in February, the Green Party convinced some disheartened Labour voters to switch. Middle-class and degree-educated voters who had turned out for Labour in the previous local elections were also fairly attracted to voting Green, but that in itself was not enough to secure a Green victory.
In Gorton & Denton, Longsight and Levenshulme – wards with high Muslim and Asian populations – there was both an observable buzz around town and a clear switch in polling among those groups. Muslim voters, traditionally strong Labour supporters who had also recently backed Burnham for Mayor, had by the end of the campaign perhaps switched from 2:1 in favour of Labour to 2:1 in favour of the Green candidate, Hannah Spencer. With a Muslim population of around 30% across the constituency, this tipped the balance for the Greens. They were further assisted by a prominent Muslim Workers Party councillor – who had chosen not to stand as a candidate and to support the Greens instead – campaigning door to door with a strong line on Gaza, which dovetailed with the Greens’ own strategy in areas with large Muslim populations.
It is October 2026 and, while only seven months have gone by, we’re now looking at a rebranded Labour Party, with a very different tone under Andy Burnham’s leadership and following Ed Miliband’s key intervention on West Bank settlements. It certainly did not feel like Gorton here on the street. Getting our coffee last week at our local Muslim-run Turkish café, we discovered that the whole staff were supporting Labour candidate Sagal Abdi-Wali. They said they had met her, described her as a “strong local girl” and were happy to display Labour’s posters in their homes.
What voters told us mattered
We’d not just been chatting around the area. Survation interviewed more than 500 voters in the constituency over eight days at the end of the campaign, mainly by telephone, and of strong interest was what voters told us about the top issue that would influence their vote.
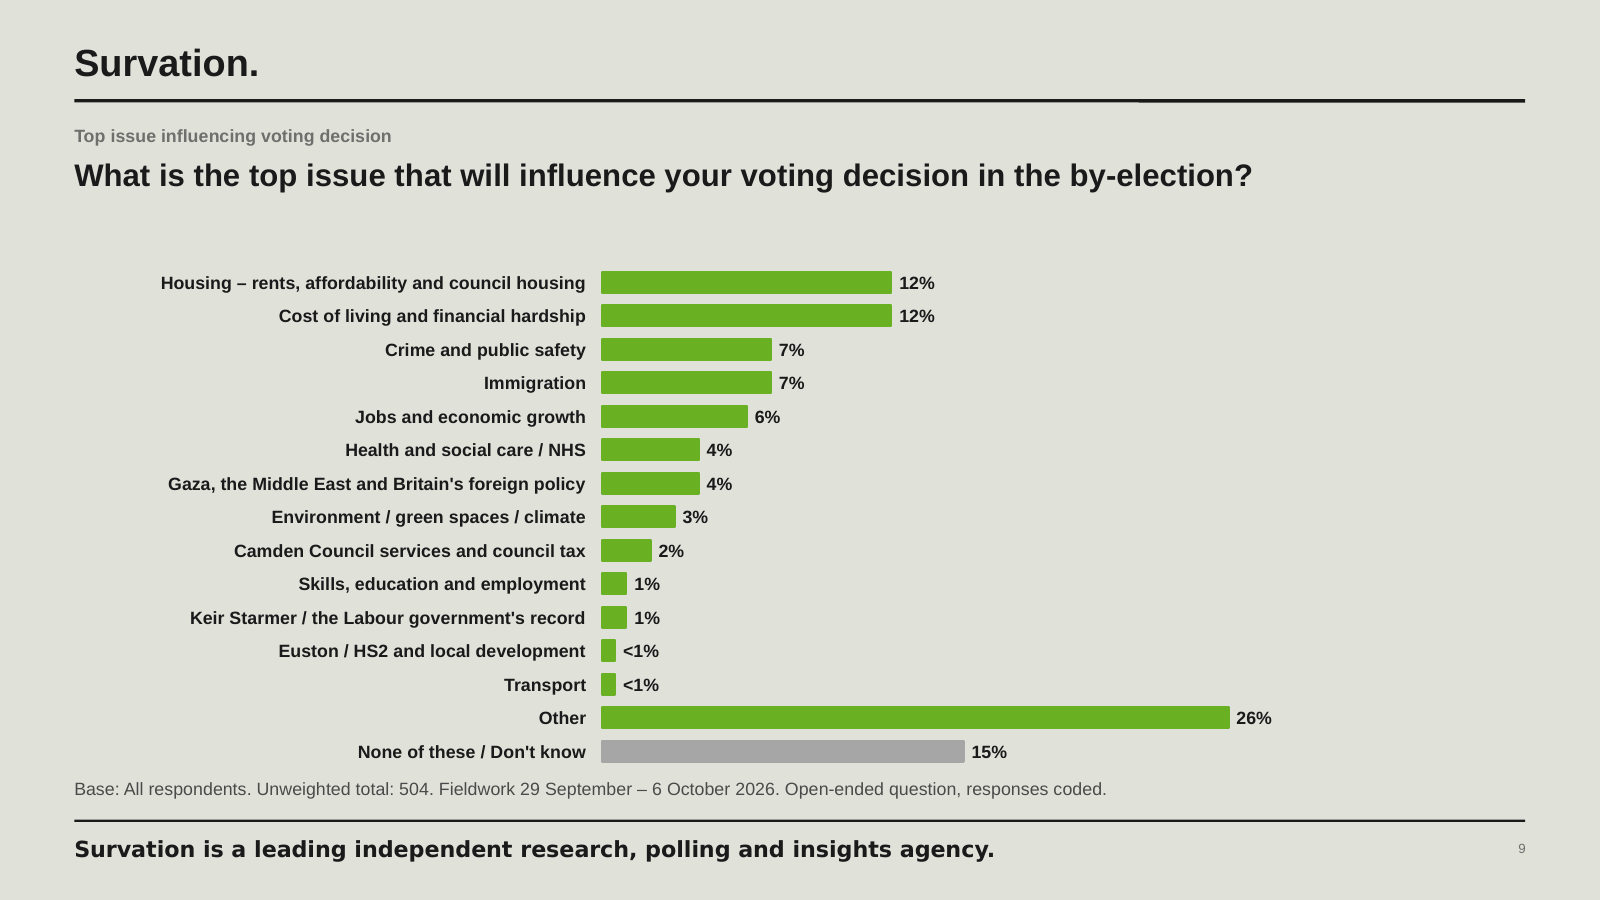
As you can see, housing – rents, affordability and council housing – was the joint top issue here, alongside cost of living and financial hardship. Among all voters, Gaza, while certainly important to many, was not top of voters’ minds in deciding how to vote.
There were differences by ethnicity. Among Asian voters, cost of living and financial hardship was the clear top issue, named by 16%, ahead of housing at 11%. Health and the NHS also featured more strongly (7%, against 4% across the seat), while immigration was much less of a factor, raised by just 3% of Asian voters compared with 9% of white voters. Notably, Gaza and foreign policy was not materially more likely to be named as the top issue by Asian voters (5%) than by voters overall (4%).
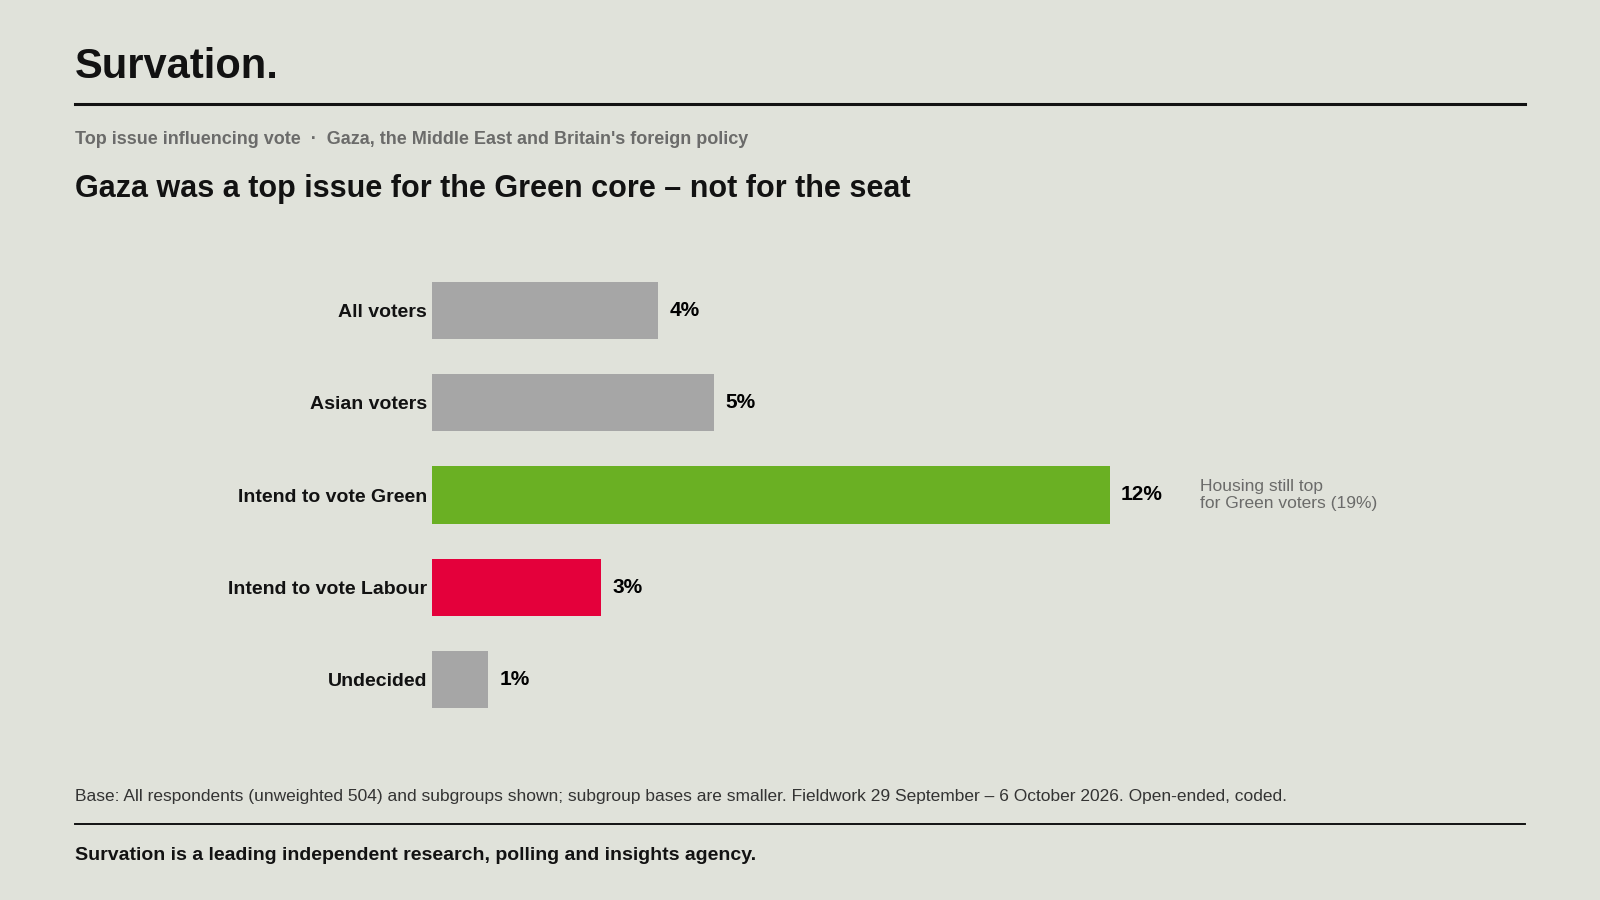
The issue did matter to one group: Green voters. Gaza was the top issue for 12% of those intending to vote for Zack Polanski, against 3% of Labour’s voters and 1% of those still undecided. Even then it sat behind housing, which 19% of Green voters named. Gaza was a motivating issue for the Green core here. It was not a recruiting one.
Who voted for whom
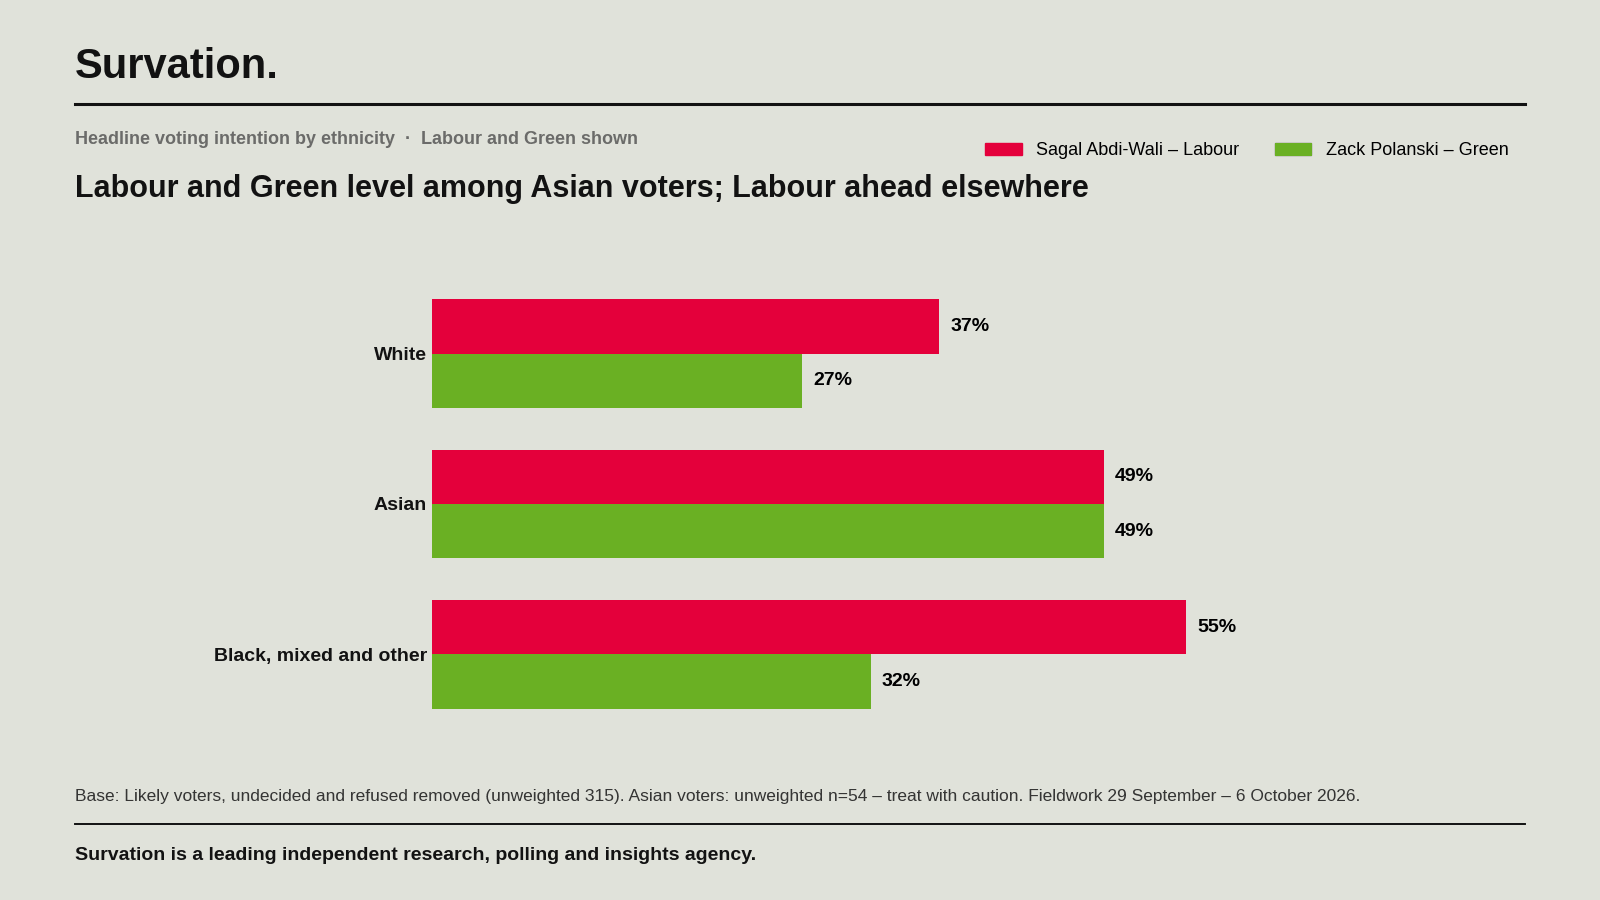
The vote itself followed the issues. Among Asian voters our poll had Labour and the Greens level, each on 49% – a long way from Gorton, where Labour’s Muslim support collapsed by the end of the campaign, but not a Labour stronghold either. A third of Asian voters told us they didn’t yet know enough about Sagal Abdi-Wali to have a view of her; Polanski they knew, and liked, with a net favourability of +26 among them. Labour’s lead in the seat was built elsewhere: among Black, mixed and other minority voters, where Abdi-Wali led Polanski by 55% to 32%, and among white voters, where she led 37% to 27% with Reform, the Conservatives and the Lib Dems splitting the remainder. The Greens held their ground among Asian voters. They did not advance.
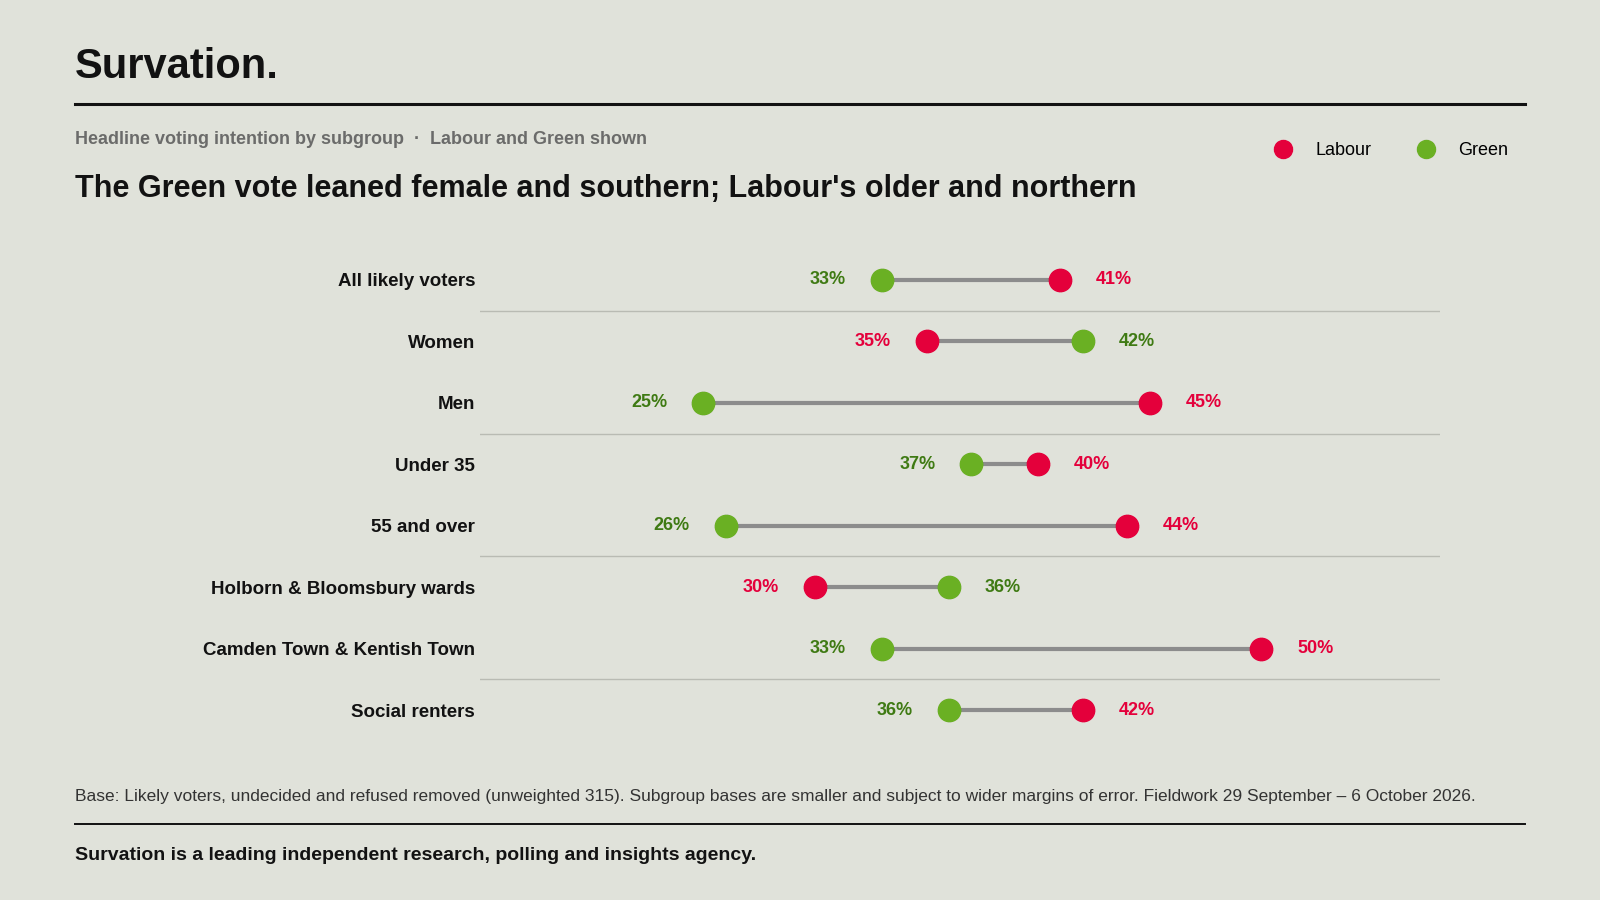
The Green vote was a particular shape in other ways. Women in the constituency favoured Polanski over Abdi-Wali by 42% to 35%; men favoured Abdi-Wali by 45% to 25%. Under-35s split almost evenly, 40% Labour to 37% Green. Over-55s backed Labour by 44% to 26%, and it was among them that Reform found its 16%. Geographically, the Greens led in the southern wards around Holborn and Bloomsbury, by 36% to 30%, while Labour’s strength was in Camden Town and Kentish Town, where it led by 50% to 33%. Social renters, the largest tenure group in the seat, went 42% Labour to 36% Green.
The Green ceiling
When the Green Party and the Camden People’s Alliance (which worked with the Greens tactically) stood here in May 2026, their results were impressive: a combined vote share in the mid-30s overall, and eight seats between them.
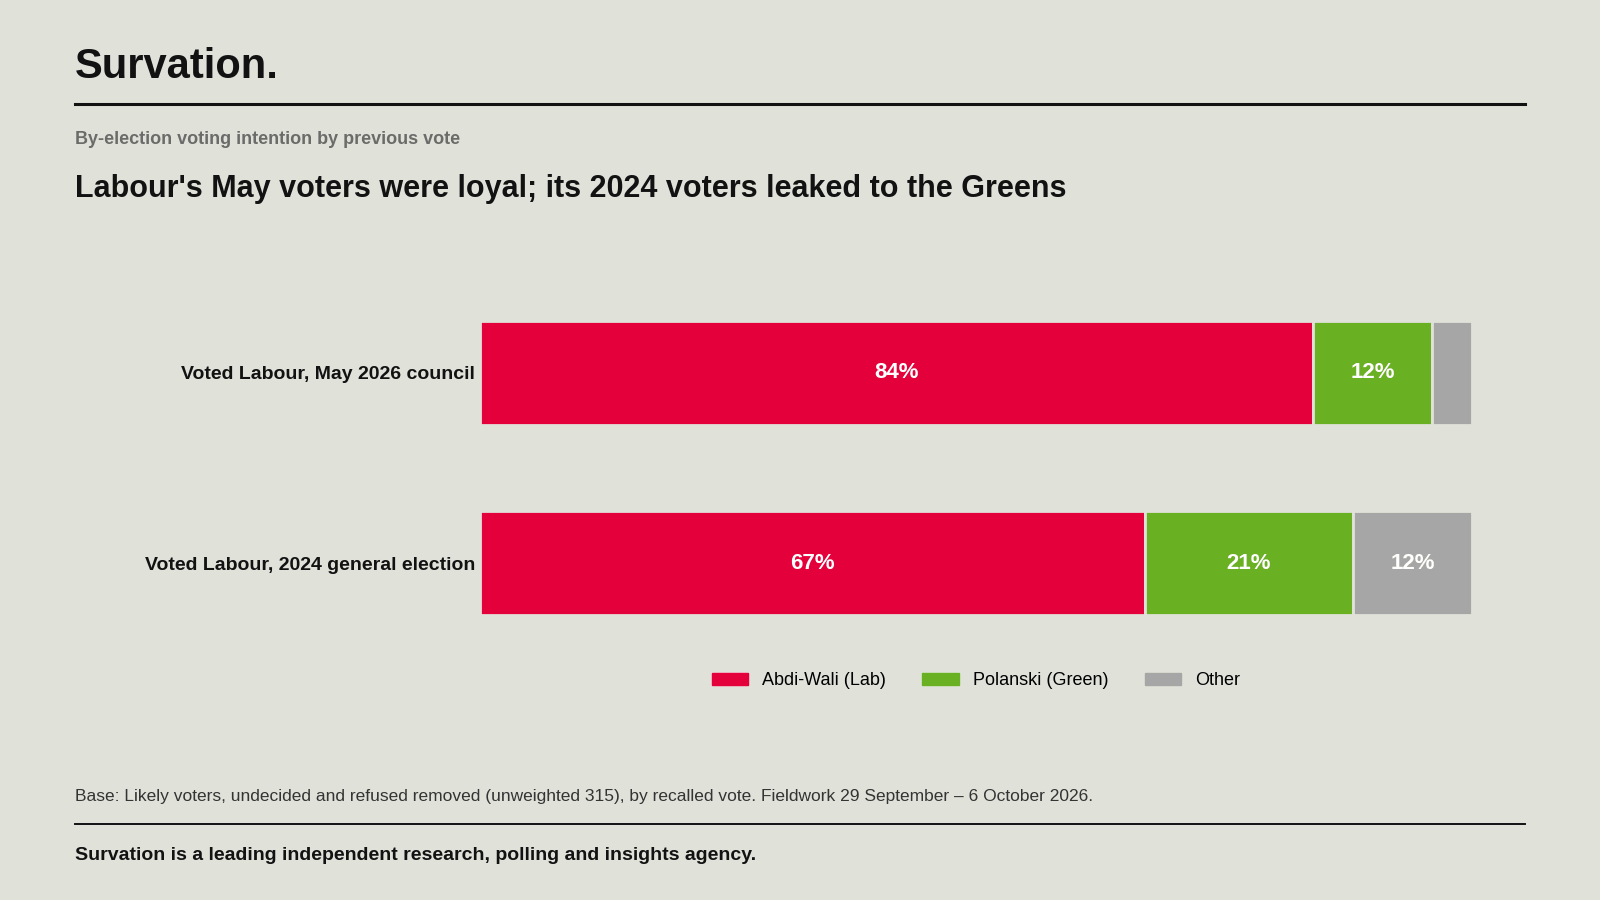
That coalition largely held. Nearly four in five of those who voted Green or CPA in May told us they would vote for Polanski; around one in six had moved to Labour. Labour’s own May voters were, if anything, more loyal, with 84% sticking with Abdi-Wali and 12% going Green. Among those who voted Labour at the 2024 general election – for Keir Starmer, in this seat – 67% were staying with Labour and 21% had gone Green. So the Greens kept almost everything they had won in May, and found almost nothing new. The ceiling, not the floor, was the problem.
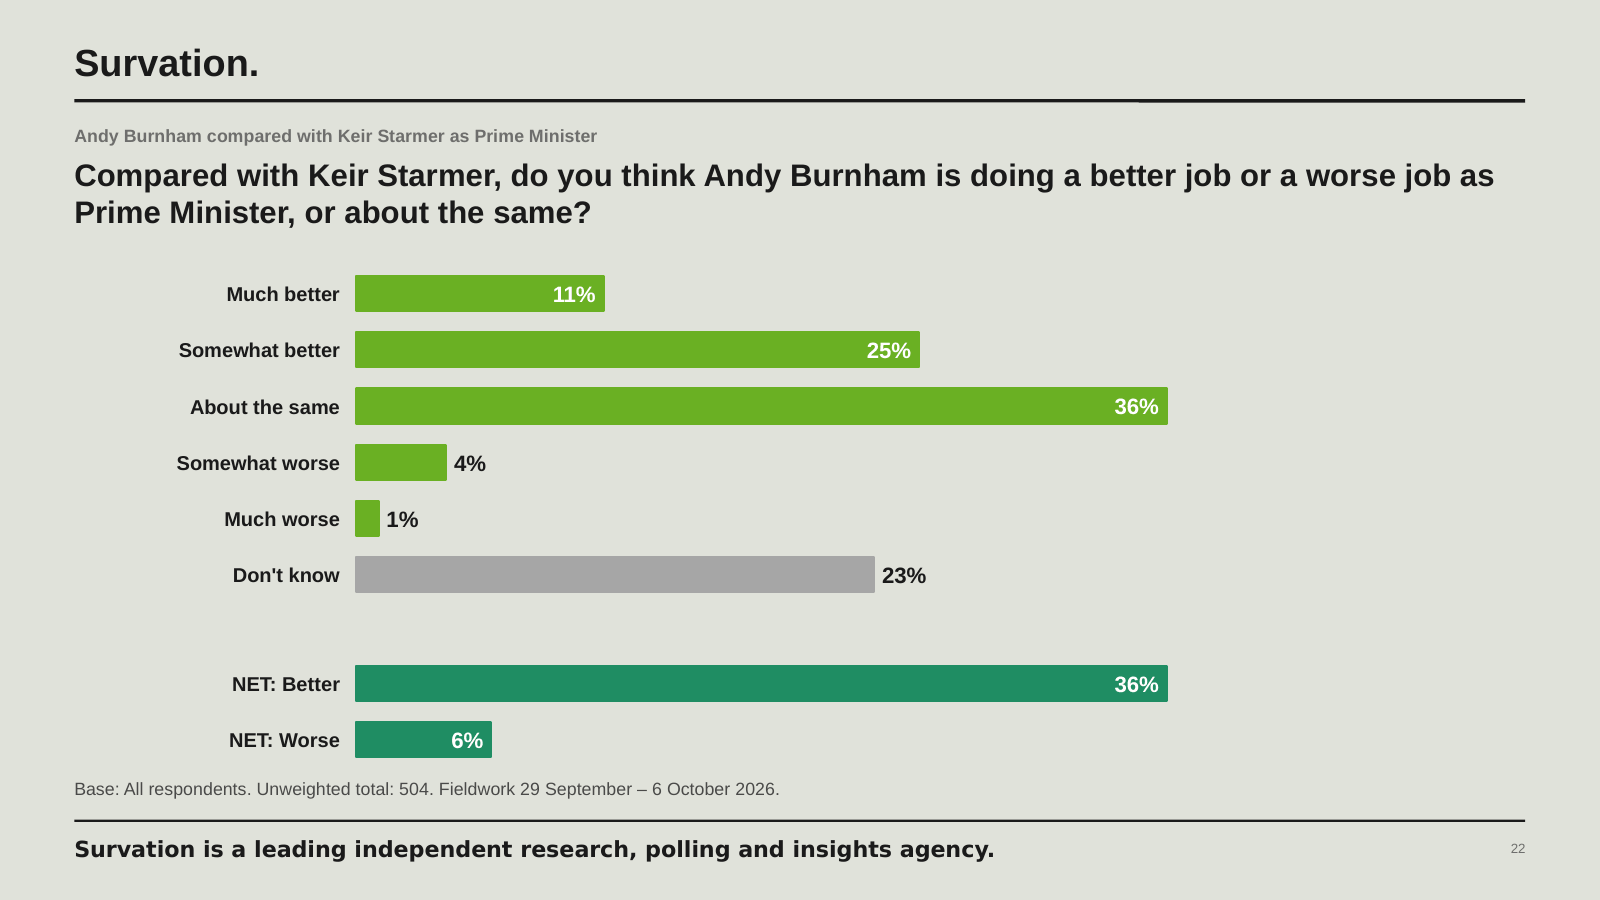
The reason is visible in what Green-intending voters told us about Andy Burnham. In the Burnham-led Labour era, many Green voters have been attracted by his softer-left message – something picked up in our national polling – and here, half of Polanski’s own voters said Burnham was doing a better job as Prime Minister than Keir Starmer. Just 4% said worse. His net favourability among them was +21. These are people voting against Labour while approving of its leader. In Gorton in February, the equivalent voters were voting against a Prime Minister they disliked. That is the difference a change of leader makes to a by-election.
Leaders and candidates
Here, we can see that while Green leader and candidate Zack Polanski has a net favourability rating of +11, the public in Holborn and St Pancras score Labour’s leader at +24. Labour’s candidate, Sagal Abdi-Wali, has a favourability rating (+7) similar to Polanski’s and, despite her association with the former incumbent, looks to voters like a very different prospect from Keir Starmer (−19).
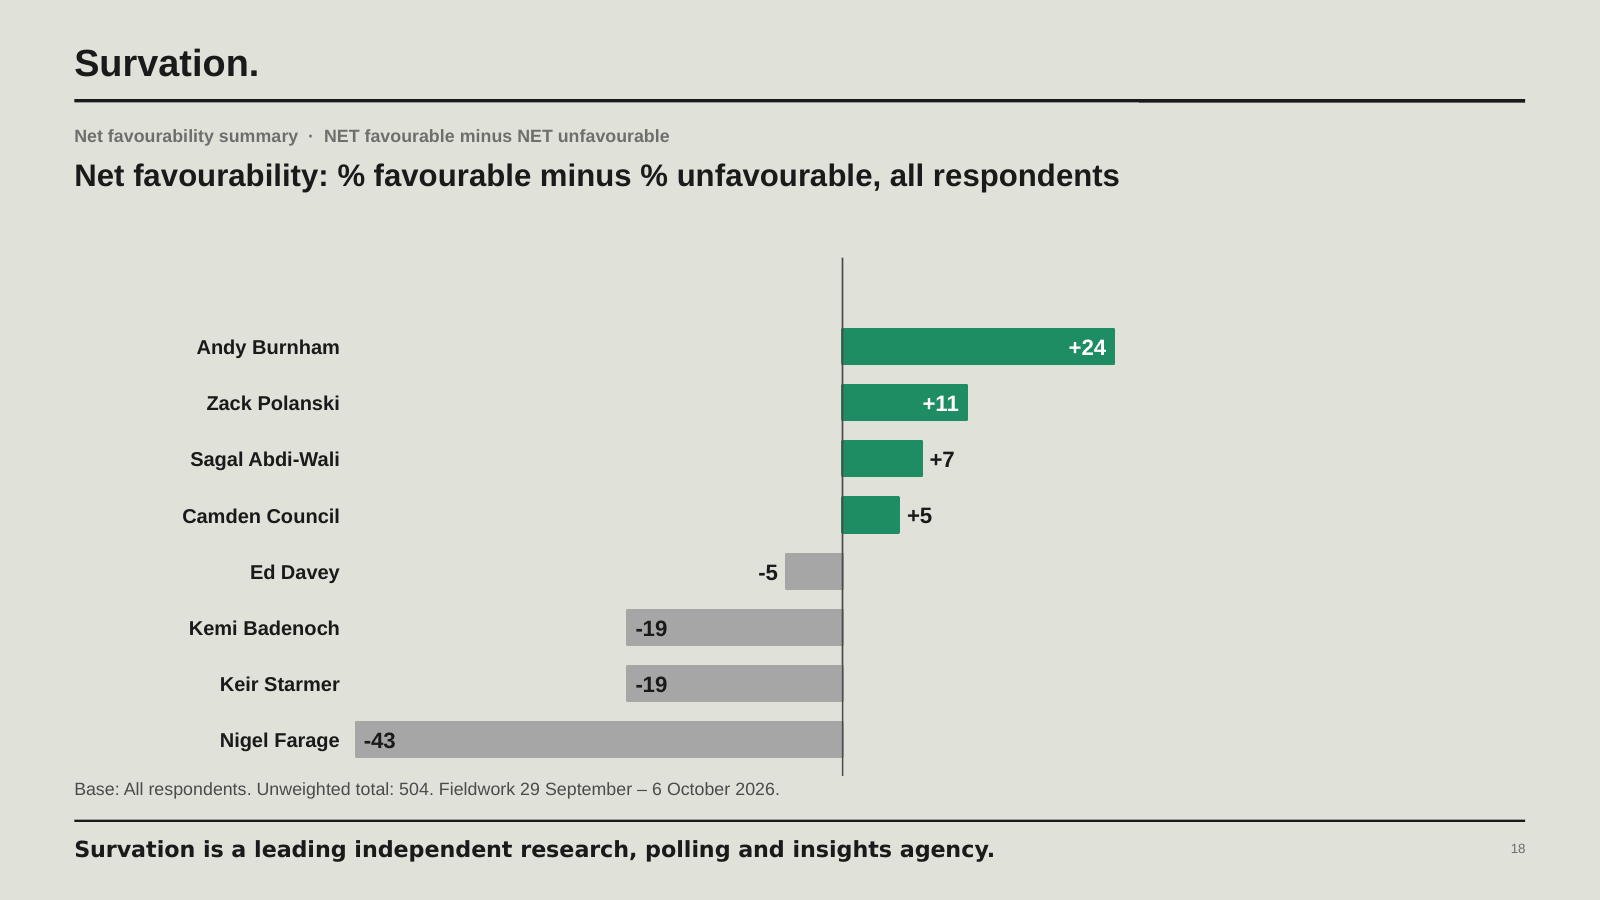
Two things sit underneath those headline numbers. The first is that Abdi-Wali was less known rather than less liked: 22% of voters said they didn’t know her well enough to rate her, against 13% for Polanski, and she was leader of a council that voters themselves score only marginally positively (+5). The second is that Polanski was not toxic to Labour’s voters – they rated him mildly positively, +8 – whereas Abdi-Wali was underwater with Green voters at −11. Polanski’s problem was never his own reputation.
When voters were asked to compare Burnham’s current performance with Keir Starmer’s, the difference was even more stark. In this seat, having Andy Burnham as Prime Minister seemed to be a clear benefit to Labour’s prospects of winning, in contrast to Labour’s former leader, who was in post at May’s elections. Starmer retains a positive rating only among his own 2024 voters, at +12; among those intending to vote Green he sits at −58.
The rest of the field
The other candidates tell their own story. Reform UK took 9% in our poll, in a seat where Nigel Farage’s net favourability is −43 and 52% of voters are very unfavourable towards him – a reminder of the party’s ceiling in inner London even as it runs Labour close nationally. Reform’s voters were the only group for whom immigration was the dominant issue, named by a third of them. The Conservatives, on 7%, were running against a leader rated −19 here. The Liberal Democrats’ 5% came largely from Haverstock and Primrose Hill, where they polled 14%; a quarter of voters didn’t know Ed Davey well enough to rate him. And George Galloway, who stood here explicitly on Gaza, registered 2%. If this were a Gaza by-election, it was not visible in his column. Restore Britain, whose candidate we did not prompt by name, was the one party on the ballot our poll could not see coming – more on that below.
What voters expected
Although perhaps a quarter of voters in the constituency said they were still undecided when we closed fieldwork on the Tuesday before polling day, the seat looked set to prefer Labour in this by-election:
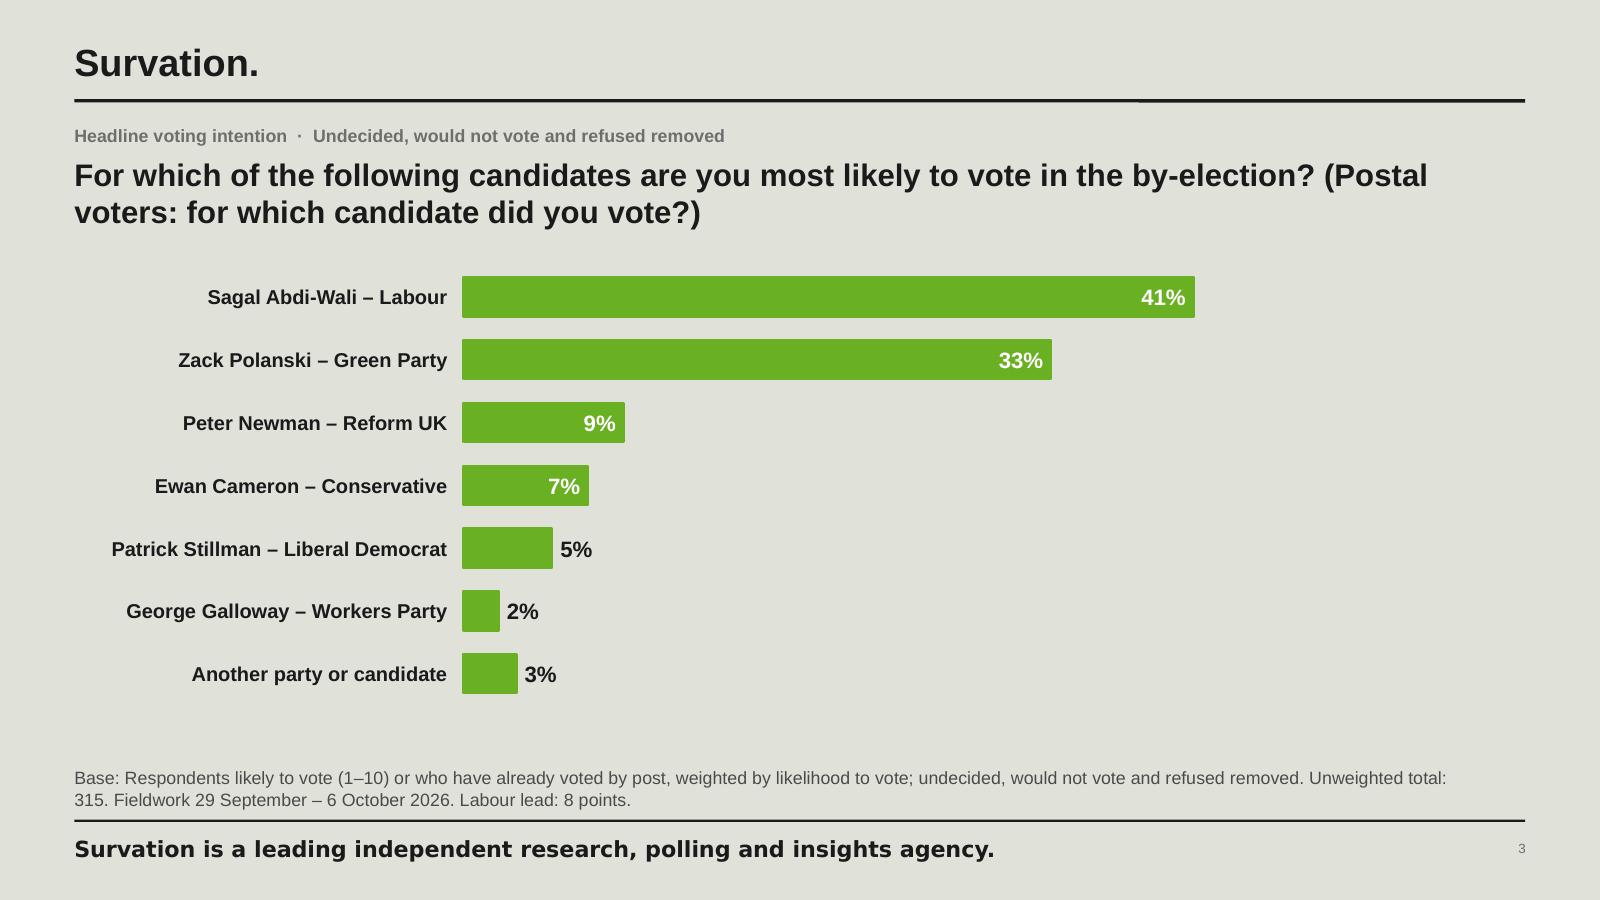
The Greens threw everything at this seat. They fielded their leader as the candidate and brought in as many supporters as they could muster. Yet our poll put Zack Polanski on 33% – no better than the mid-30s the Greens and their allies managed here in May’s council elections.
What changed is who they were up against, and the national mood has moved markedly since. In Survation’s first national poll after May’s elections, in mid-June, Labour stood at just 19%. In our latest, completed three days before polling day, Labour were on 30% and leading Reform UK by six points. The Greens have gone the other way, from a high of 12% earlier this year to 8%. In May the Greens were running here against Keir Starmer’s Labour, and Starmer is still at −19 in his old seat. In October they were running against Andy Burnham’s, and Burnham is the most popular politician we tested, at +24.
There was no enthusiasm gap to rescue the Greens either: 62% of Labour’s voters and 60% of the Greens’ told us they were certain to vote. Seen that way, holding their May share took everything the Greens had. Gaza, which helped power the Green win in Gorton, was the top issue for just 4% of voters here. Polanski himself was not the problem – he was better known and slightly better liked than Labour’s candidate. The ground had shifted under him.
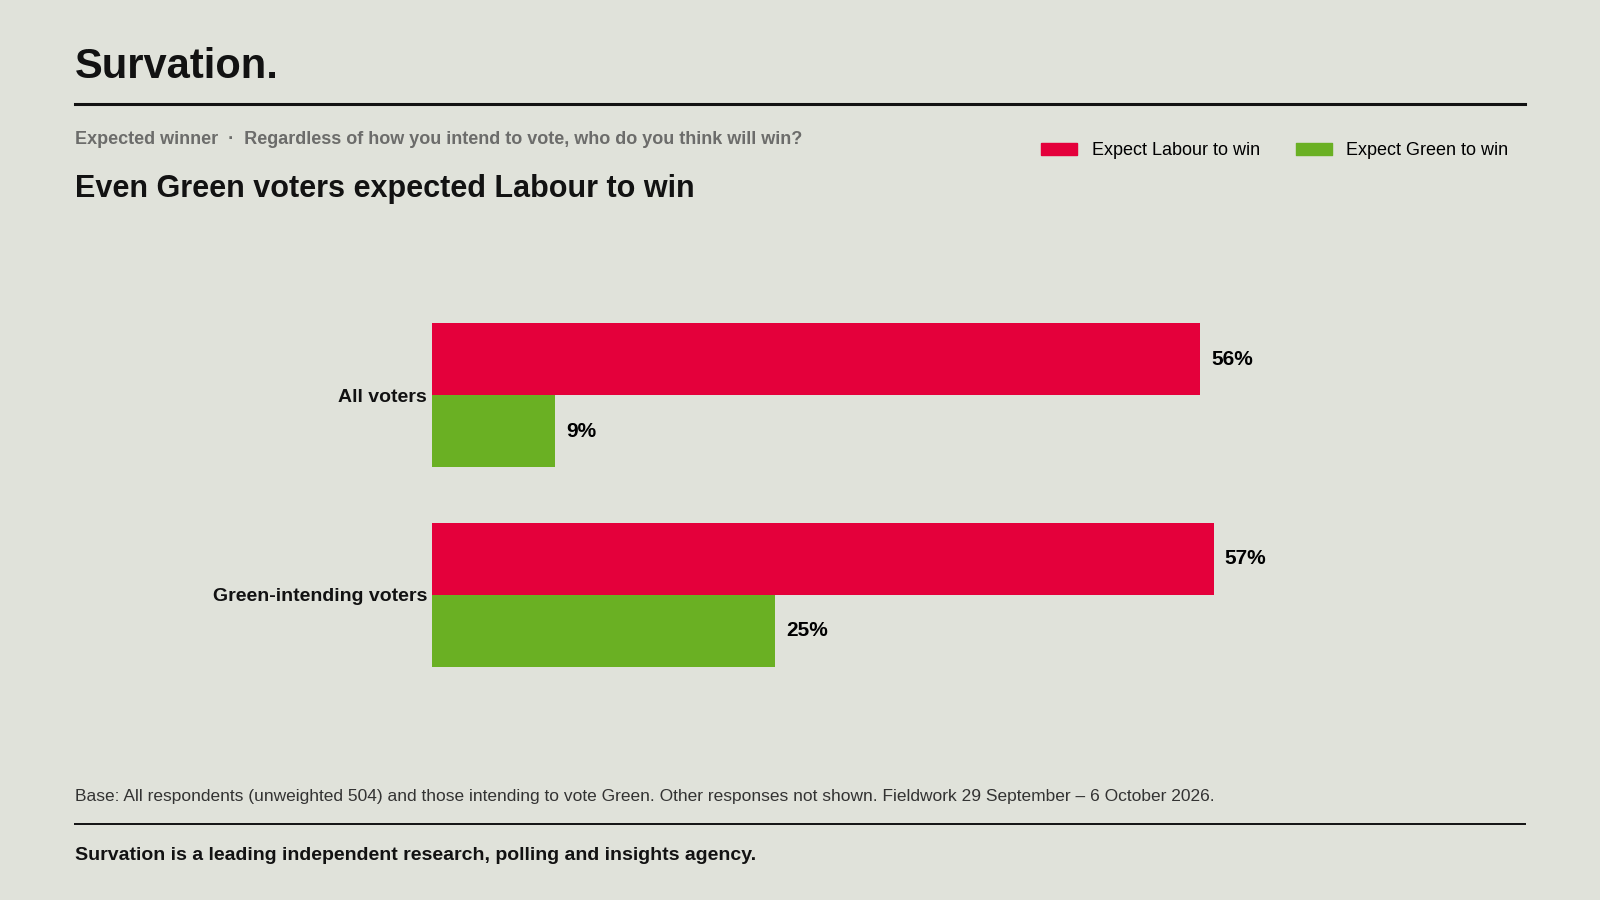
Voters seemed to sense it: whatever their own preference, 56% expected Labour to win and just 9% the Greens. That included the Greens’ own supporters, 57% of whom expected Labour to win and only a quarter of whom expected Polanski to.
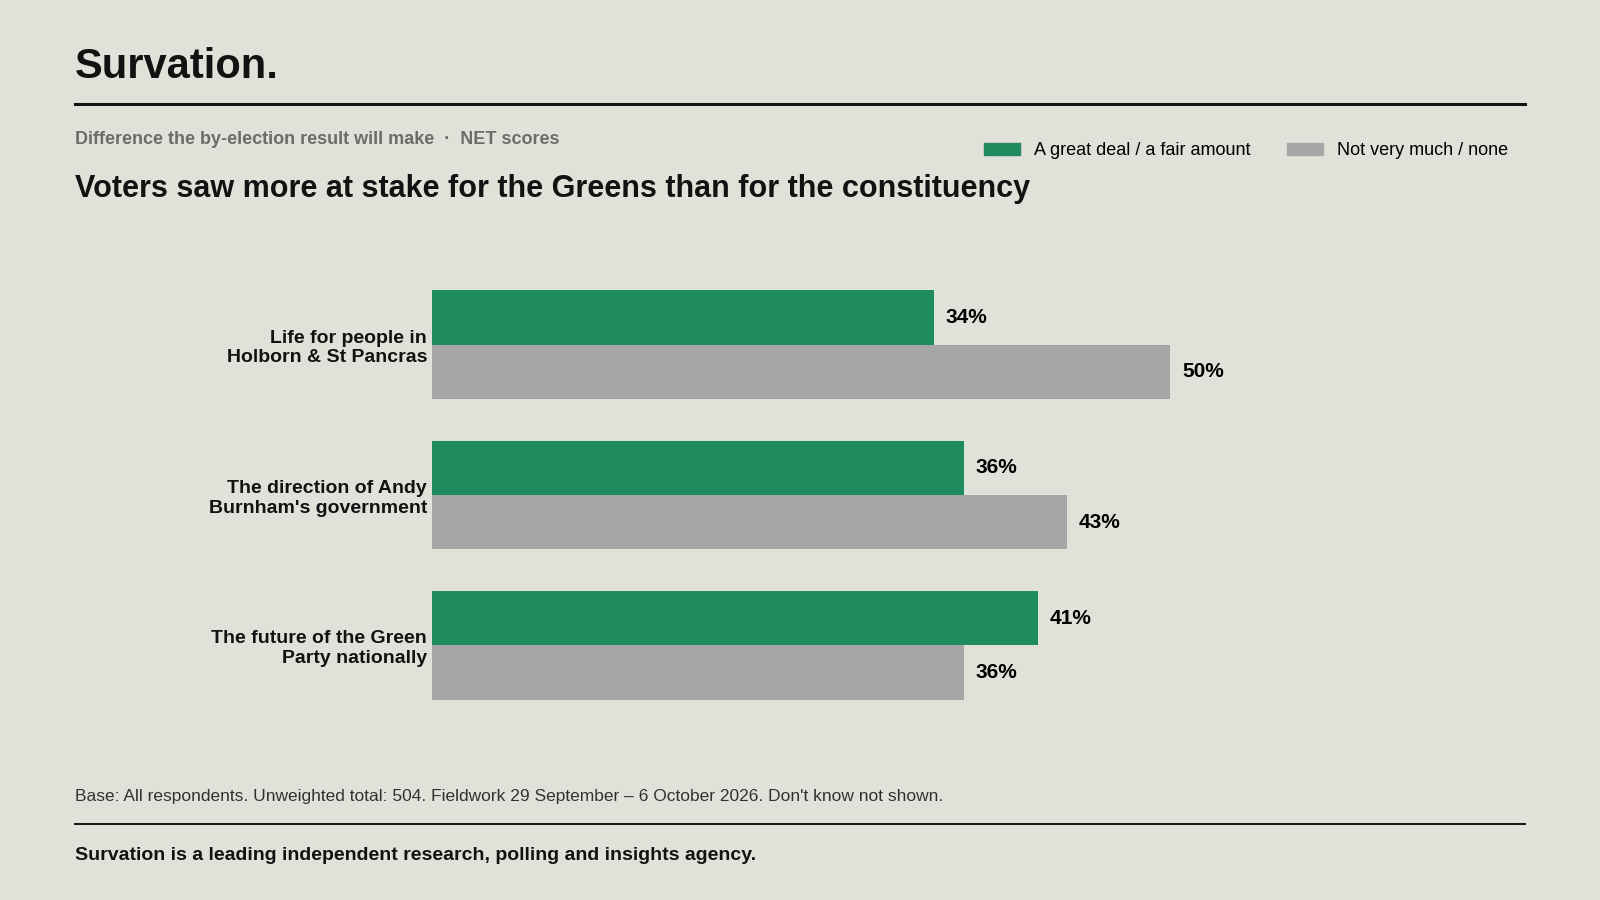
Asked what the result would change, voters saw more at stake for the Green Party nationally (41% said a great deal or a fair amount) than for life in the constituency itself (34%). Green voters were the clearest-eyed of all about that: 72% of them said the result mattered for their party’s future nationally.
What happened on the day
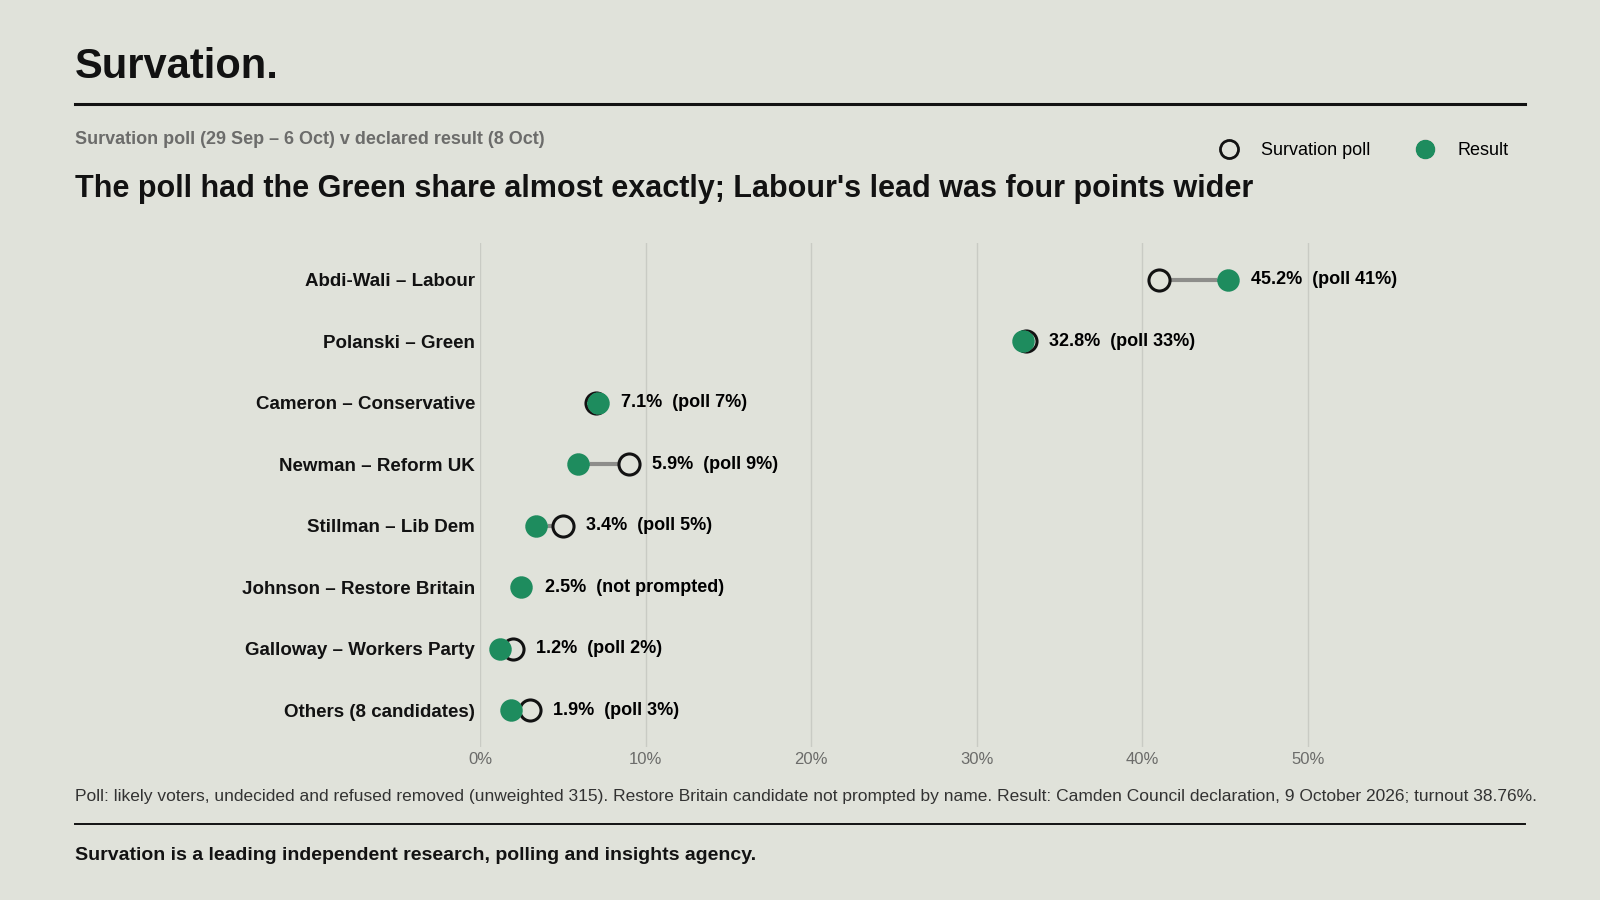
On the day, Sagal Abdi-Wali won with 12,292 votes, 45.2% of those cast, to Zack Polanski’s 8,928 (32.8%) – a majority of 3,364, or 12.4 points, on a turnout of 38.8%. The Greens’ share was what our poll had said it would be. Labour’s was four points higher.
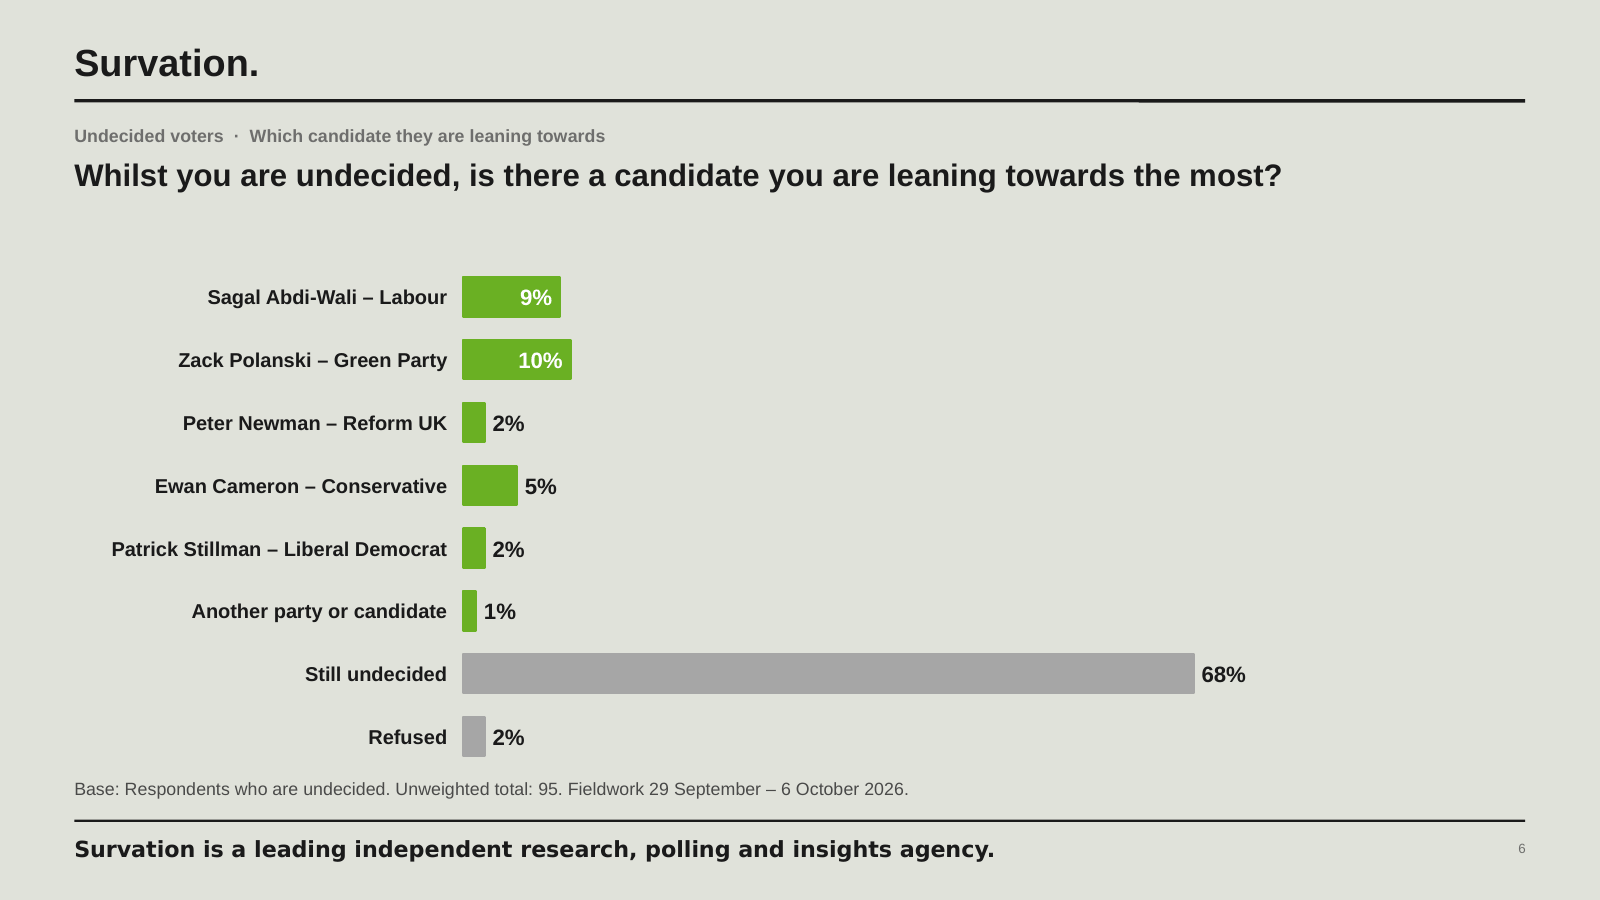
That gap is the undecided. A quarter of likely voters hadn’t made up their minds when we closed fieldwork on the Tuesday, and more than two-thirds of those had no lean at all. Where they did lean they split evenly – roughly one in ten each towards Abdi-Wali and Polanski – and they were a little less certain to vote than committed supporters. The result suggests those who turned out broke for Labour, and the rest stayed at home. Either way, the Greens found no late surge among them.
The other movement was on the right. We had Reform UK on 9%; Peter Newman took 5.9%. But Restore Britain, whose candidate was not prompted by name in our poll, took 2.5%, and UKIP a further 0.2% – which puts the combined vote to the right of the Conservatives at 8.7%, almost exactly where we had Reform alone. Restore’s late arrival on the ballot clipped Reform’s share rather than adding to it, and left Reform fourth, behind a Conservative candidate who polled precisely the 7% we had him on. The Lib Dems fell short of their 5%, and George Galloway, on 1.2%, did not reach the 2% we gave him.
Against 2024, the headline is the Greens’ 22-point gain, from 10.4% to 32.8% – easily their best result here. But that is the May council share, carried over by the party’s leader with the national campaign behind him, and not a point more. Labour, with its vote down less than four points on Keir Starmer’s 2024 share and turnout down 15, held the seat more comfortably than almost anyone – including its own supporters – expected.
| Candidate | Survation poll 29 Sep–6 Oct | Leaners allocated | Result 8 Oct | Result v poll |
|---|---|---|---|---|
| Sagal Abdi-Wali – Labour | 41% | 40% | 45.2% | +4.2 |
| Zack Polanski – Green | 33% | 33% | 32.8% | −0.2 |
| Ewan Cameron – Conservative | 7% | 8% | 7.1% | +0.1 |
| Peter Newman – Reform UK | 9% | 9% | 5.9% | −3.1 |
| Patrick Stillman – Liberal Democrat | 5% | 5% | 3.4% | −1.6 |
| Tyler Johnson – Restore Britain* | – | – | 2.5% | – |
| George Galloway – Workers Party | 2% | 2% | 1.2% | −0.8 |
| Others (8 candidates) | 3% | 3% | 1.9% | −1.1 |
| Labour lead (points) | 8 | 7 | 12.4 | +4.4 |
*Restore Britain’s candidate was not prompted by name in the poll. Source: Camden Council declaration, 9 October 2026; 27,211 valid votes, turnout 38.76%.
Survation interviewed 504 adults aged 18+ living in the Holborn and St Pancras constituency by telephone and online panel, supplemented by a small number of face-to-face interviews, between 29 September and 6 October 2026. Data were weighted by age, sex, ward, ethnicity, highest qualification, 2024 general election vote and May 2026 council election vote. Headline voting intention is based on 315 respondents who were likely to vote or had already voted by post, with undecided and refused responses removed; a second figure (40% Labour, 33% Green) allocates undecided respondents to the candidate they say they are leaning towards. Figures for subgroups are based on smaller samples and are subject to wider margins of error. The poll was commissioned by Dale Vince.
Tables are available here.
Survation is an MRS company partner, a member of the British Polling Council and abides by their rules. To find out more about Survation’s services, and how you can conduct a telephone or online poll for your research needs, please visit our services page.
If you are interested in commissioning research or to learn more about Survation’s research capabilities, please contact John Gibb on 020 3818 9661, email researchteam@survation.com, or visit our services page.
For press enquiries, please call 0203 818 9661 or email media@survation.com
< Back